
 7 months ago
91
7 months ago
91
PROTECT YOUR DNA WITH QUANTUM TECHNOLOGY
Orgo-Life the new way to the future Advertising by AdpathwayDisclaimer: This site is not affiliated with the National Hurricane Center, Hurricane Hunters, Storm Prediction Center, or National Weather Service. ALL forecasts herein are the result of my analysis, (to which you will see me at times, insert excerpts from various agencies due to the nature of the importance of the information) and I am solely responsible for the content. As ALWAYS, follow the National Hurricane Center, National Weather Service, and your local Emergency Management officials for emergency decisions. In addition, this is strictly a FORECAST OFFICE. I CANNOT make decisions regarding travel plans, etc. My purpose, is to provide you the information, based solely on information I analyze, and the accuracy of the information at hand of the time of analysis, so you may make informed decisions.
(T. F. “Storm” Walsh)
For those who have donated to my site, your help has been greatly appreciated. If you are not aware, donations to my site help pay for subscriptions to sites I use as well as software updates, which provide all the models and information used in my forecasts. To donate, please click the DONATE button to the right side of the page, or on the graphic of the dog. Any help you provide is immensely appreciated!
DONATIONS ACCEPTED AND APPRECIATED


I will reiterate, my forecasts are based on the available information at the time of analysis, and are only as accurate as the information analyzed and the solutions provided.
Good day everyone!
I want to wish EVERYONE a Happy and Blessed THANKSGIVING!
I will be out of the office tomorrow, through the end of the month, as we will be traveling to spend the Thanksgiving holiday with family. I should be back on DEC. 01 to resume forecasting, but will once again be out of the office OOA Dec. 3 – 4 to travel to Gainesville as my wife is having a minor outpatient surgical procedure.
The Storm Prediction Center (SPC) has issued a MARGINAL risk for severe thunderstorms in the current DAY 1 Outlook: ACROSS PARTS OF MS/AL/TN/KY…
…SPC SUMMARY…
Isolated strong to severe storms are possible today and tonight across parts of Mississippi and Tennessee into western and northern Alabama and possibly southern Kentucky.
SPC DAY 1 SEVERE THUNDERSTORM OUTLOOK (LINKED FOR OUTLOOK TEXT)
TORNADO PROBABILITY
Probability of a tornado within 25 miles of a point.
HAIL PROBABILITY
Probability of one inch diameter hail or larger within 25 miles of a point.
DAMAGING THUNDERSTORM WIND PROBABILITY
Probability of damaging thunderstorm winds or wind gusts of 50 knots or higher within 25 miles of a point.
The following is the day 1 outlook from the CSU – MLP severe weather forecast map:
CSU – MLP DAY 1 FORECAST (CLICK FOR LARGER IMAGE)

DAY1 PROBABILITY CONVERSION TABLE
SPC DISCUSSION EXCERPT:
The more organized/sustained scattered thunderstorms this afternoon will probably remain focused within the warm conveyor from south-central Mississippi into Alabama. On the south-southwest periphery of these storms, there will be a gradual northeastward expansion of the effective warm sector while destabilization will still remain weaker with eastward extent. Mid-level lapse rates are weak, suggesting most updrafts will struggle to intensify. However, strong deep-layer shear and moderately strong low-level shear/SRH, particularly within the aforementioned corridor, could support a couple of rotating storms capable of a tornado or damaging wind.
The following maps are from NADOCAST for tornado and hail probabilities.
12Z NADOCAST TORNADO PROBABILITY (CLICK FOR LARGER IMAGE)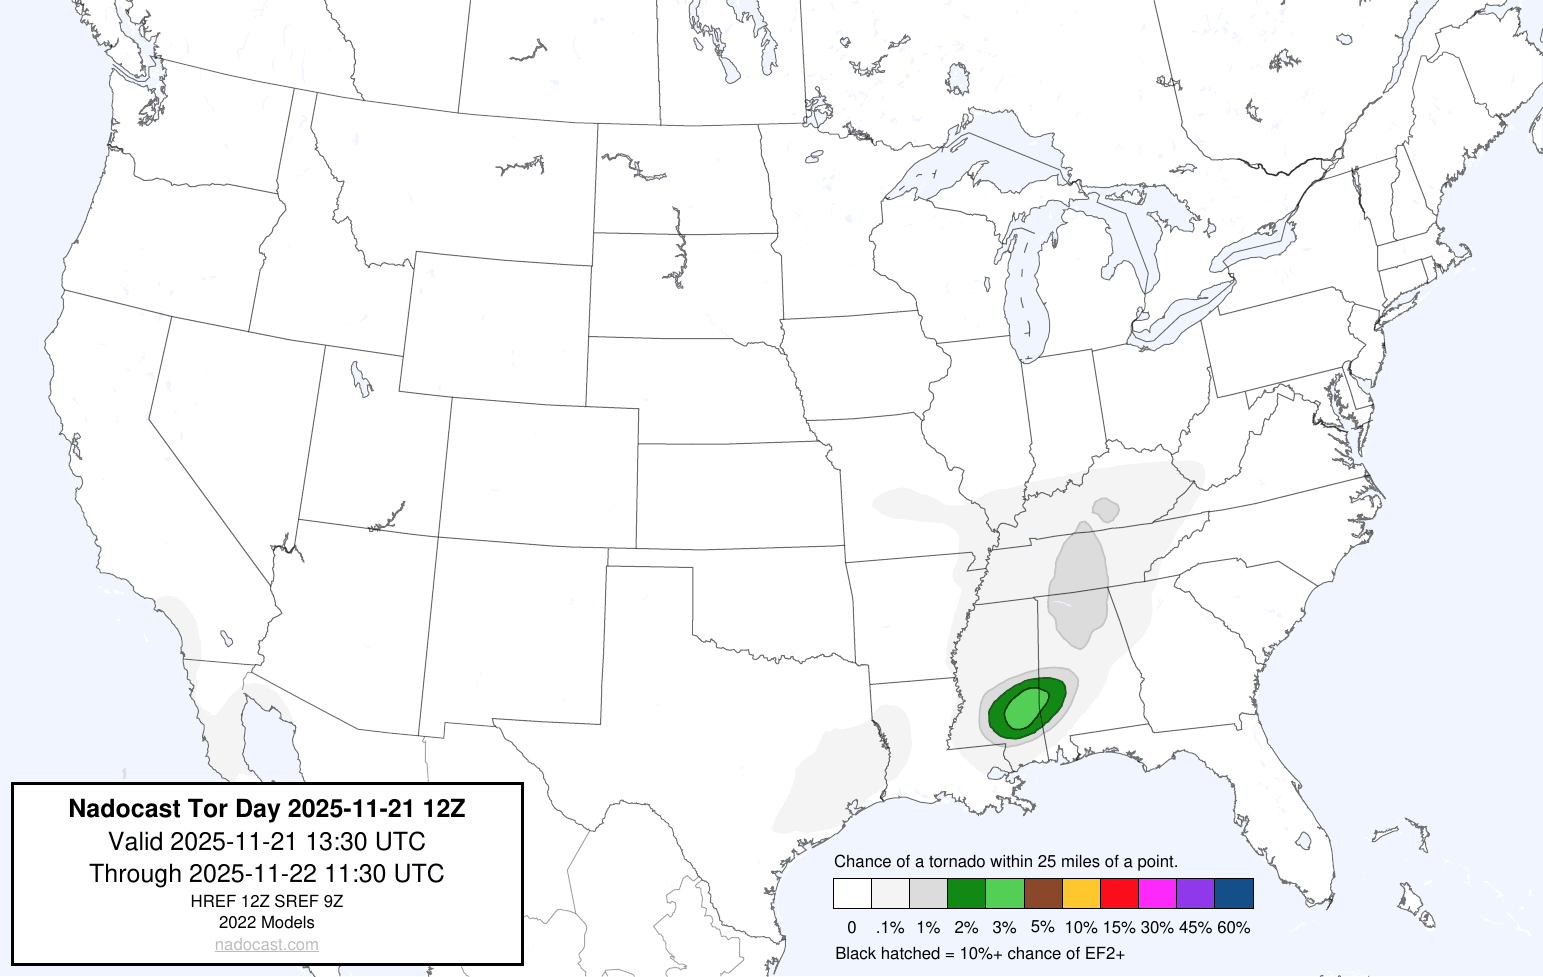
12Z NADOCAST SIGTOR PROBABILITY (CLICK FOR LARGER IMAGE)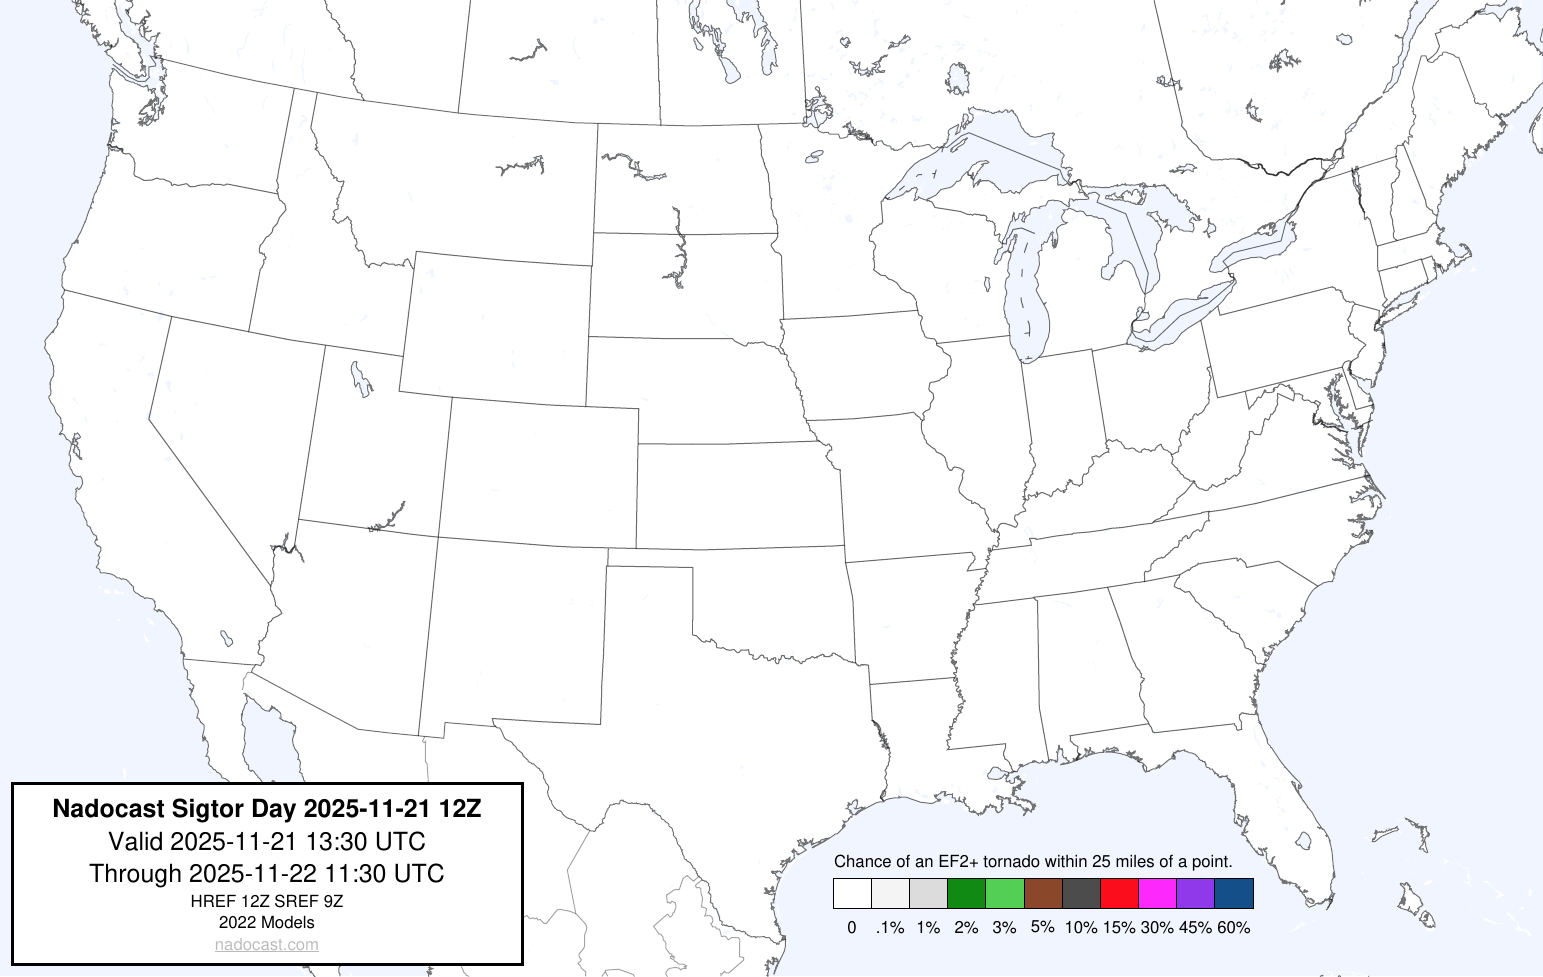
12Z NADOCAST HAIL PROBABILITY (CLICK FOR LARGER IMAGE)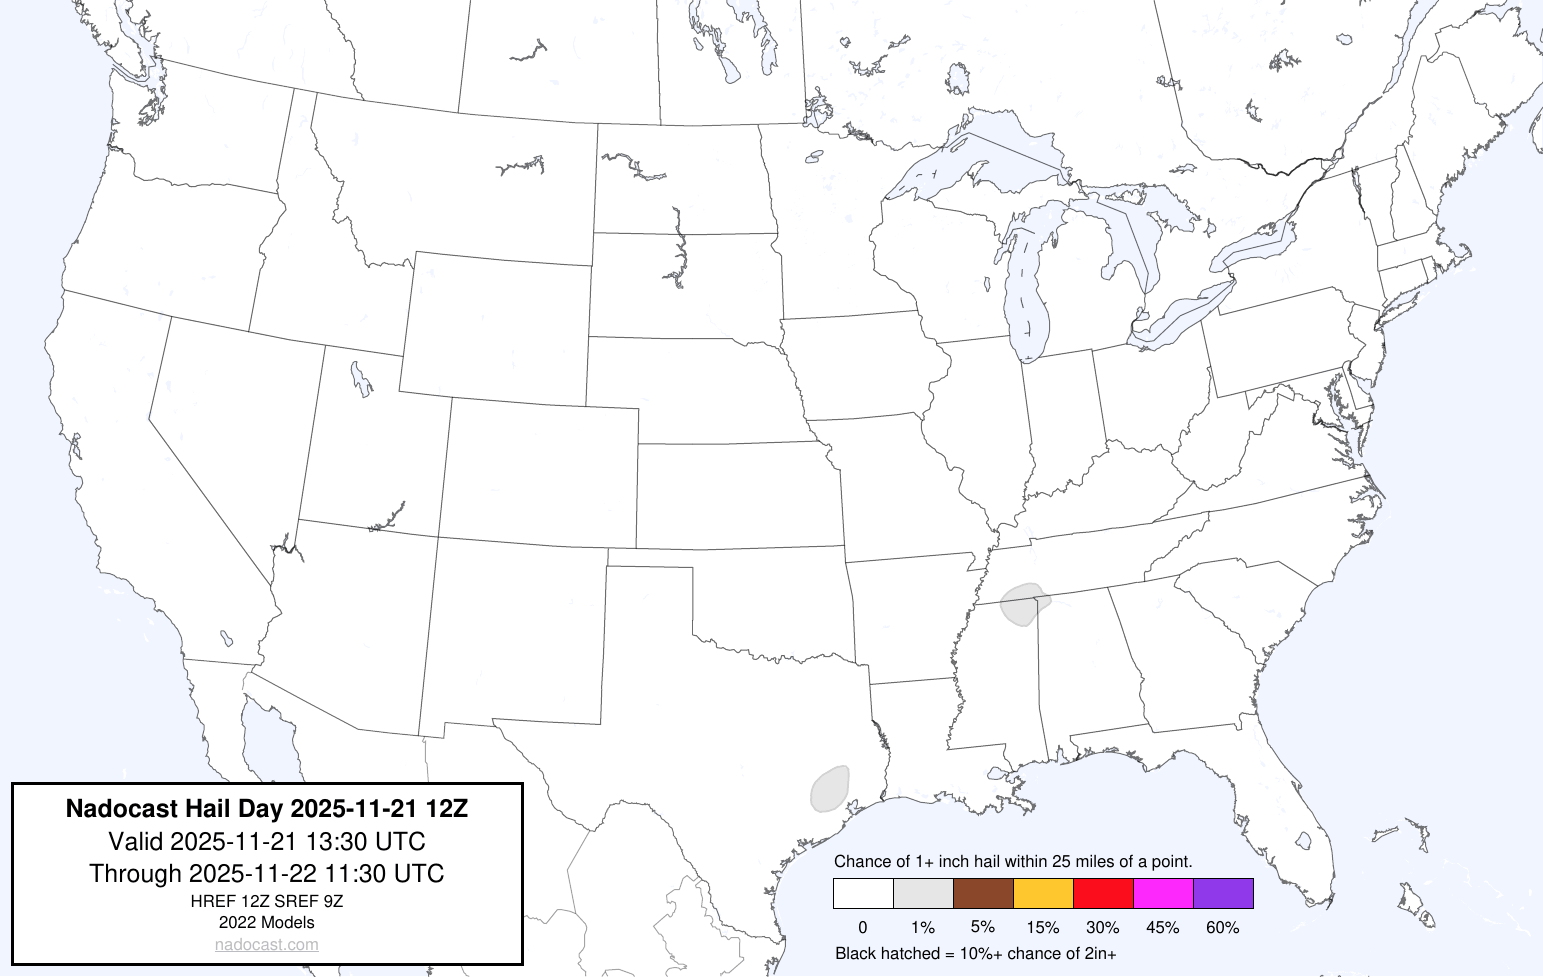
12Z NADOCAST SIGHAIL PROBABILITY (CLICK FOR LARGER IMAGE)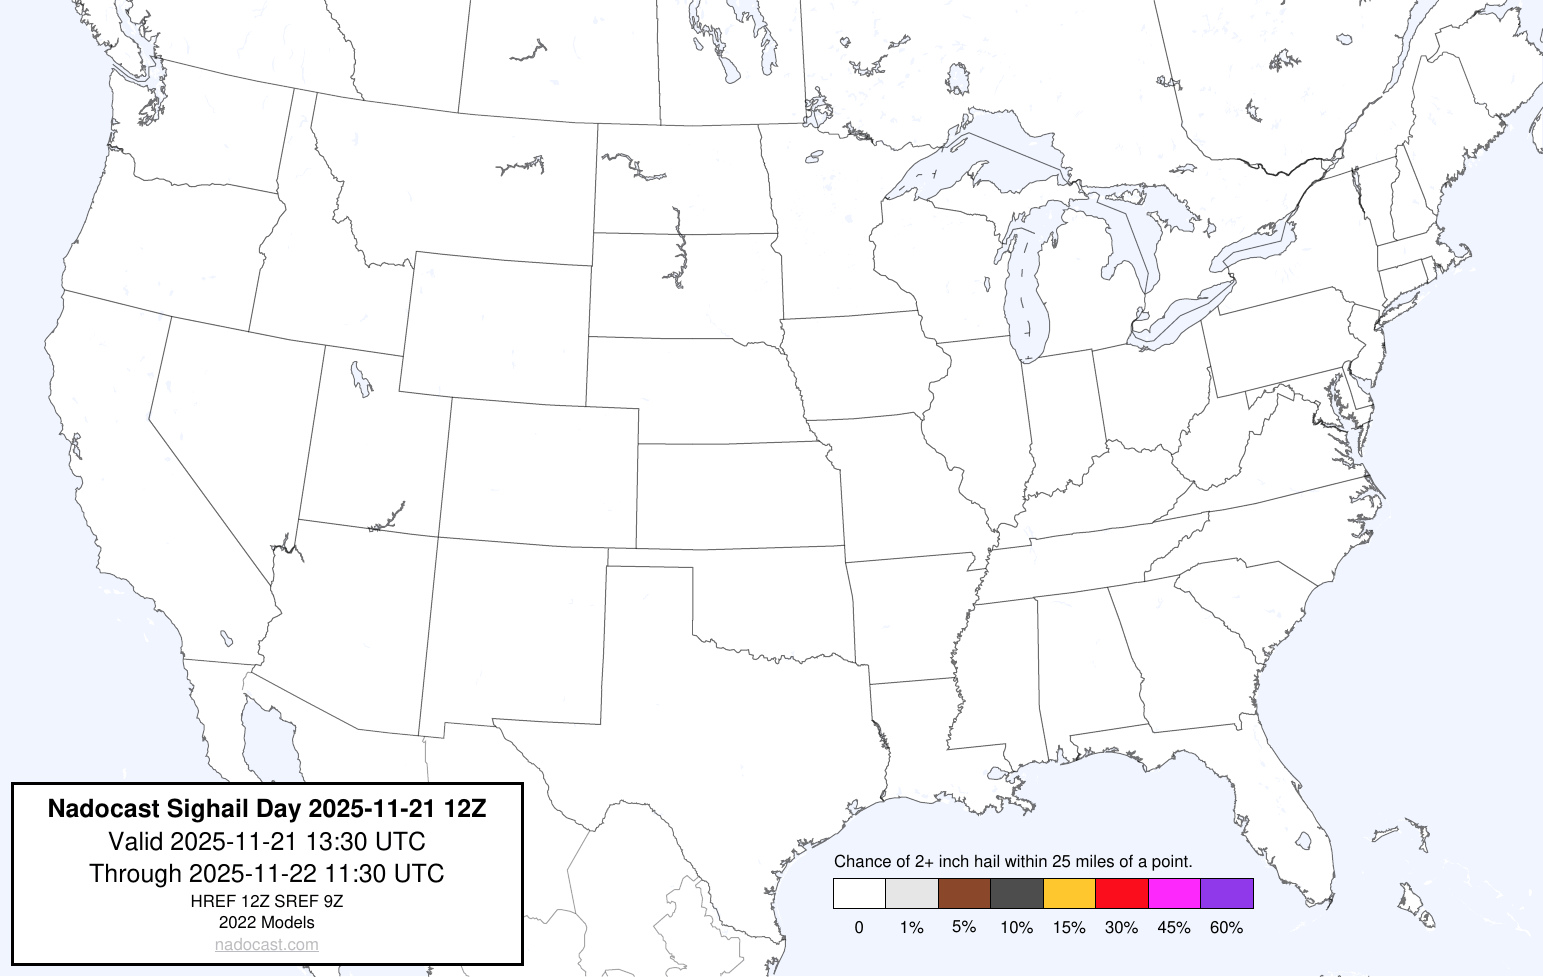
The SPC has introduced a MARGINAL tornado risk, and all threats are probable, albeit marginal, along with a low probability of hail. Storms were ongoing this morning, and this may allow for a similar setup as we saw on the 18th, where the rain cooled air could assist in instability. Based on various information from the NAM 3 km model, the atmosphere over the outlook area is mostly marginally unstable based on CAPE, normal mid level lapse rates and lifted indices of -1 to -3. I know this raises the question of how could tornado activity possibly occur? Based on research, this is possible given the 40 – 50 kt bulk (deep layer) wind shear, along with the rain cooled air from the earlier storms, and LCL (Lifted Condensation Level) being low (less than 1000 meters), along with 0 – 3km SRH running between 150 – 300 m2-m2. The following is from an online article:
Mechanisms for Tornadoes in Low-Instability Environments:
Strong Low-Level Wind Shear: Wind shear (a change in wind speed and/or direction with height) is a critical ingredient for tornado formation. Even with weak instability (normal lapse rates and weak lifted indices), significant low-level wind shear can create horizontal spinning air currents (horizontal vorticity) near the ground. When a thunderstorm updraft moves over this horizontally spinning air, it can tilt the rotation vertically, forming a tornado.
Non-Supercell Tornadoes (Landspouts/Waterspouts): These types of tornadoes often form along pre-existing surface boundaries (like convergence lines or outflow boundaries from previous storms) where there is already some weak, localized rotation. The updraft of a developing, non-rotating (or weakly rotating) thunderstorm can then stretch this existing vertical rotation, rapidly intensifying the spin into a tornado, even in environments that lack the high Convective Available Potential Energy (CAPE) or steep lapse rates typical of supercells.
Dynamic Instabilities and Forcing: In some cases, dynamic processes play a more important role than the release of latent heat (instability). Forcing mechanisms, such as strong lift along a front or a vigorous cold pool (rain-cooled air) interaction with warm, moist air ahead of it, can create a powerful, localized updraft that generates a tornado without a traditional, deep-layer unstable atmosphere.
Low-Level Moisture and CAPE: While deep-layer CAPE might be weak, adequate low-level moisture can still create sufficient low-level instability (0-3 km CAPE) to support tornadogenesis. This low-level instability, combined with strong shear, helps maintain the strong vertical velocities near the surface needed to stretch the rotating column of air into a tornado.
Low LCL Heights: A low Lifted Condensation Level (LCL), which means the cloud base is closer to the ground, is often associated with a higher likelihood of tornadoes. This proximity allows the low-level rotation to be more effectively drawn into the storm’s main updraft and concentrated at the surface.
Based on my analysis of the severe weather indices, the forecast calls for a marginal to borderline moderate unstable atmosphere. Indices indicate at the moment, that some isolated severe thunderstorms may be possible with isolated supercells developing by afternoon through early evening. Based on analysis, some isolated tornadoes may occur, especially within the 2% TORNADO outline, and should be weak (EF0 – EF1). Based on moderate CAPE values, increased mid level lapse rates, and lifted indices, large hail will be possible. Based on downdraft CAPE analysis, damaging thunderstorm winds / gusts are in the forecast as well. Strongest indices should occur mainly within the 2% TORNADO outline, and currently lie mainly within the outline over the Mississippi area.
Based on analysis of model animations, the current outlook, and analysis of indices, the strongest convection and indices should occur approximately between 3:00 p.m. CDT – 5:00 P.M. CDT
CAPE VALUES FORECAST
Indices were analyzed from the NAM 3km, NAM 12km, HRRR 3km, CIPS DETERMINISTIC, and SPC SREF model guidance.
The following were the forecast parameters and indices analyzed this morning. Bear in mind, indices recorded below are for the time of peak intensity. Some indices meanings are posted below the indices themselves, and the NWS page containing a more extensive explanation can be accessed further on in the synopsis:
SBCAPE: 250 – 1500 j/kg-1
MLCAPE: 250 – 1000 j/kg-1
MUCAPE: 250 – 1500 j/kg-1
SRH 0 -1 km: 100 – 200 m2/s2
SRH 0 -3 km: 150 – 300 m2/s2
SRH EFFECTIVE: 50 – 100 m2/s2
L. I.: -1 to -3
SCP: 1 – 3
STP: 1.0 – 1.6
0 -6 km SHEAR: 40 kts – 50 kts
EFF. SHEAR: 30 kts – 40 kts
MID LEVEL LAPSE RATE: 5.5C – 6.0C
DEWPOINT: 61F – 70F
EHI: 0.6 – 1.2
TOTAL TOTALS INDEX: 42C – 43C
K INDEX: 28C – 34C
SWEAT INDEX: 150 – 225
THOMPSON INDEX: 29 – 37
CRAVEN – BROOKS INDEX: 10,000 – 15,000
CAPE 
ENERGY HELICITY INDEX
K INDEX
TOTAL TOTALS INDEX
STORM RELATIVE HELICITY
LIFTED INDEX
SWEAT VALUES
THOMPSON INDEX
Craven SigSvr Parameter:
The simple product of 100mb MLCAPE and 0-6km magnitude of the vector difference (m/s; often referred to as “deep layer shear”) accounts for the compensation between instability and shear magnitude. Using a database of about 60,000 soundings, the majority of significant severe events (2+ inch hail, 65+ knot winds, F2+ tornadoes) occur when the product exceeds 20,000 m3/s3.
A little fact on SRH values and tornadoes from NOAA / NWS
A little fact on SRH values and tornadoes from NOAA / NWS
Storm Relative Helicity (m2 s-2)
SRH (Storm Relative Helicity) is a measure of the potential for cyclonic updraft rotation in right-moving supercells, and is calculated for the lowest 1-km and 3-km layers above ground level. There is no clear threshold value for SRH when forecasting supercells, since the formation of supercells appears to be related more strongly to the deeper layer vertical shear. Larger values of 0-3-km SRH (greater than 250 m2 s-2) and 0-1-km SRH (greater than 100 m2 s-2), however, do suggest an increased threat of tornadoes with supercells. For SRH, larger values are generally better, but there are no clear thresholds between non-tornadic and significant tornadic supercells.
STP ( Significant Tornado Parameter) EXPLAINED:
A majority of significant tornadoes (EF2 or greater damage) have been associated with STP values greater than 1, while most non-tornadic supercells have been associated with values less than 1 in a large sample of RAP analysis proximity soundings.
SCP (Supercell Composite Parameter) EXPLAINED:
A multiple ingredient, composite index that includes effective storm-relative helicity (ESRH, based on Bunkers right supercell motion), most unstable parcel CAPE (muCAPE) and convective inhibition (muCIN), and effective bulk wind difference (EBWD). Each ingredient is normalized to supercell “threshold” values, and larger values of SCP denote greater “overlap” in the three supercell ingredients. Only positive values of SCP are displayed, which correspond to environments favoring right-moving (cyclonic) supercells.
The following are the SCP (Supercell Composite Parameter) and STP (Significant Tornado Parameter) forecast maps from the NAM 3KM model. Generally, the higher the values and brighter the color, indicates a greater probability of strong thunderstorm and / or tornadic activity over an area:
NAM 3KM SCP FORECAST 3:00 P.M. CDT NOV. 21 – 8:00 P.M. CDT NOV. 21
NAM 3KM STP FORECAST 3:00 P.M. CDT NOV. 21– 8:00 P.M. CDT NOV. 21
HRRR 3KM SCP FORECAST 3:00 P.M. CDT NOV. 21 – 8:00 P.M. CDT NOV. 21
HRRR 3KM STP FORECAST 3:00 P.M. CDT NOV. 21 –8:00 P.M. CDT NOV. 21
Please use the following maps, which should update automatically, for Mesoscale Discussions and Convective Watches. You may have to refresh your browser, or click on the graphics. I have provided the SPC homepage link below, so you may get the updated information regarding any changes to the outlook:
https://www.spc.noaa.gov/classic.html
SPC MESOSCALE DISCUSSIONS (CLICK IMAGE FOR UPDATES)
SPC CONVECTIVE WATCHES (CLICK IMAGE FOR UPDATES)
IF A TORNADO WARNING IS ISSUED FOR YOUR AREA, TAKE IMMEDIATE SAFE AND STURDY SHELTER!
As I will be out of the office for the upcoming week, The SPC has also designated a MARGINAL risk for severe thunderstorms for Sunday, and the CSU – MLP forecast indicates probabilities for the upcoming week. Please use the SPC link posted above to remain informed while I’m away.
SPC DAY 3 OUTLOOK

CSU – MLP 6 DAY FORECAST Elsewhere, as the SSW cycle continues, we are still slated for colder temperatures to occur around Thanksgiving and into the 1st week of December, with Arctic air eventually affecting the western portion of the U.S. The following are the current forecast lowest temperatures for Thanksgiving, and the 10mb temperature and height anomalies indicating the SSW:
ECMWF MIN. TEMPERATURE FORECAST NOV. 17

ECMWF 10 MB TEMPERATURE AND HEIGHT FORECAST

The following sites will explain most of the severe weather and tornado values listed above, and will give you an idea of what to expect:
ENVIRONMENTAL INDICES AND PARAMETERS NWS
https://www.weather.gov/lmk/indices
THE WEATHER PREDICTION
http://www.theweatherprediction.com/severe/indices/
The following links will connect you to the Excessive Rainfall probabilities and River Flood Outlook:
EXCESSIVE RAINFALL
https://www.wpc.ncep.noaa.gov/qpf/excessive_rainfall_outlook_ero.php
SIGNIFICANT RIVER FLOOD OUTLOOK
https://www.wpc.ncep.noaa.gov/nationalfloodoutlook/index.html
The following NWS Watch / Warning map will provide local NWS information for your area. Click the image, then once it refreshes, click on your area of interest to view any special weather statements, hazards or advisories for your area.
NWS WATCH / WARNING DISPLAY (LINKED…CLICK MAP, THEN YOUR AREA)
NWS DOPPLER RADAR LOOP (LINKED, CLICK RADAR MAP)
RAP RADAR (CLICK IMAGE THEN GO TO LOOP DURATION AND PICK LENGTH OF LOOP, THEN CLICK RADAR SITE)
CARIBBEAN RADAR (CLICK IMAGE TO ACCESS ANIMATION)
You may direct any questions by contacting me personally, ANYTIME, at: [email protected]
Have a blessed day!
T. F. “STORM” WALSH III
GMCS, USCG (ret)
METEOROLOGIST / HURRICANE SPECIALIST /SEVERE WEATHER SPECIALIST


 English (US) ·
  French (CA) ·