
 3 months ago
118
3 months ago
118
PROTECT YOUR DNA WITH QUANTUM TECHNOLOGY
Orgo-Life the new way to the future Advertising by AdpathwayDisclaimer: This site is not affiliated with the National Hurricane Center, Hurricane Hunters, Storm Prediction Center, or National Weather Service. ALL forecasts herein are the result of my analysis, (to which you will see me at times, insert excerpts from various agencies due to the nature of the importance of the information) and I am solely responsible for the content. As ALWAYS, follow the National Hurricane Center, National Weather Service, and your local Emergency Management officials for emergency decisions. In addition, this is strictly a FORECAST OFFICE. I CANNOT make decisions regarding travel plans, etc. My purpose, is to provide you the information, based solely on information I analyze, and the accuracy of the information at hand of the time of analysis, so you may make informed decisions.
(T. F. “Storm” Walsh)
For those who have donated to my site, your help has been greatly appreciated. If you are not aware, donations to my site help pay for subscriptions to sites I use as well as software updates, which provide all the models and information used in my forecasts. To donate, please click the DONATE button to the right side of the page, or on the graphic of the dog. Any help you provide is immensely appreciated!
DONATIONS ACCEPTED AND APPRECIATED


I will reiterate, my forecasts are based on the available information at the time of analysis, and are only as accurate as the information analyzed and the solutions provided.
Good day everyone!
The forecast office is closed on Sunday
The SPC now indicates severe weather risks for the remainder of the week, into Wednesday of next week:
ALL IMAGES LINKED:
DAY 2
DAY 3
DAY 4 – 8 This synopsis will cover only the central portion of the country, since this office only issues forecasts from Tornado Alley, eastward to the Eastern Seaboard and along the Gulf coast.
The Storm Prediction Center (SPC) has issued a MARGINAL risk for severe thunderstorms in the current DAY 1 Outlook: ACROSS PARTS OF THE SOUTH-CENTRAL PLAINS/OZARKS AND NORTHERN CALIFORNIA/GREAT BASIN…
…SPC SUMMARY DAY 1…
Thunderstorms with isolated large hail and severe gusts are possible this afternoon and evening across parts of the south-central Plains to the Ozarks. Strong to locally severe storms may also occur from western/northern Nevada into southeast Oregon and southwest Idaho, and also across parts of north-central California.
SPC DAY 1 SEVERE THUNDERSTORM OUTLOOK (LINKED FOR OUTLOOK TEXT)
TORNADO PROBABILITY
Probability of a tornado within 25 miles of a point.
HAIL PROBABILITY
Probability of one inch diameter hail or larger within 25 miles of a point.
DAMAGING THUNDERSTORM WIND PROBABILITY
Probability of damaging thunderstorm winds or wind gusts of 50 knots or higher within 25 miles of a point.
The following is the current CSU – MLP severe weather probability forecast maps and NSSL ML probability forecast:
CSU – MLP DAY 1 AND 2 FORECAST PROBABILITIES (CLICK FOR LARGER IMAGE)
NSSL ML DAY 1 SEVERE PROBABILITY 
CSU – MLP DAYS 3 – 8 PROBABILITIES (CLICK FOR LARGER IMAGE)

DAY 1 PROBABILITY CONVERSION TABLE
SPC DISCUSSION EXCERPT DAY 1:
…South-central Plains/Ozarks…
Scattered rain and generally weak thunderstorms will continue to accompany and reinforce a southward-shifting front, with the boundary stalling today, before starting to shift back northward late tonight. Weakening flow aloft will occur today in the presence of a building upper ridge and corresponding height rises. As outflows dissipate, ample heating/mixing is expected later today to the south of the front, where MLCAPE values may exceed 1500 J/kg across Oklahoma/Texas Panhandle and northeast New Mexico.
Even with modest overall forcing for ascent, scattered thunderstorms are expected to develop by late afternoon in the vicinity of the boundary across parts of far southern Kansas/northern Oklahoma into the Ozarks, with additional development possible near the front, and also within a post-frontal regime across the south-central High Plains vicinity.
With rather modest large-scale ascent and weak deep-layer flow across the region, storm organization and duration may generally remain somewhat limited. However, more organized cells may briefly develop on an isolated basis more immediately near the boundary, where some enhancement to effective shear/SRH will be possible. Isolated large hail appears to be the most likely hazard, although localized strong/damaging wind gusts could also occur.
The following are maps from NADOCAST for tornado and hail probabilities. Click for larger images:
12Z NADOCAST TORNADO PROBABILITY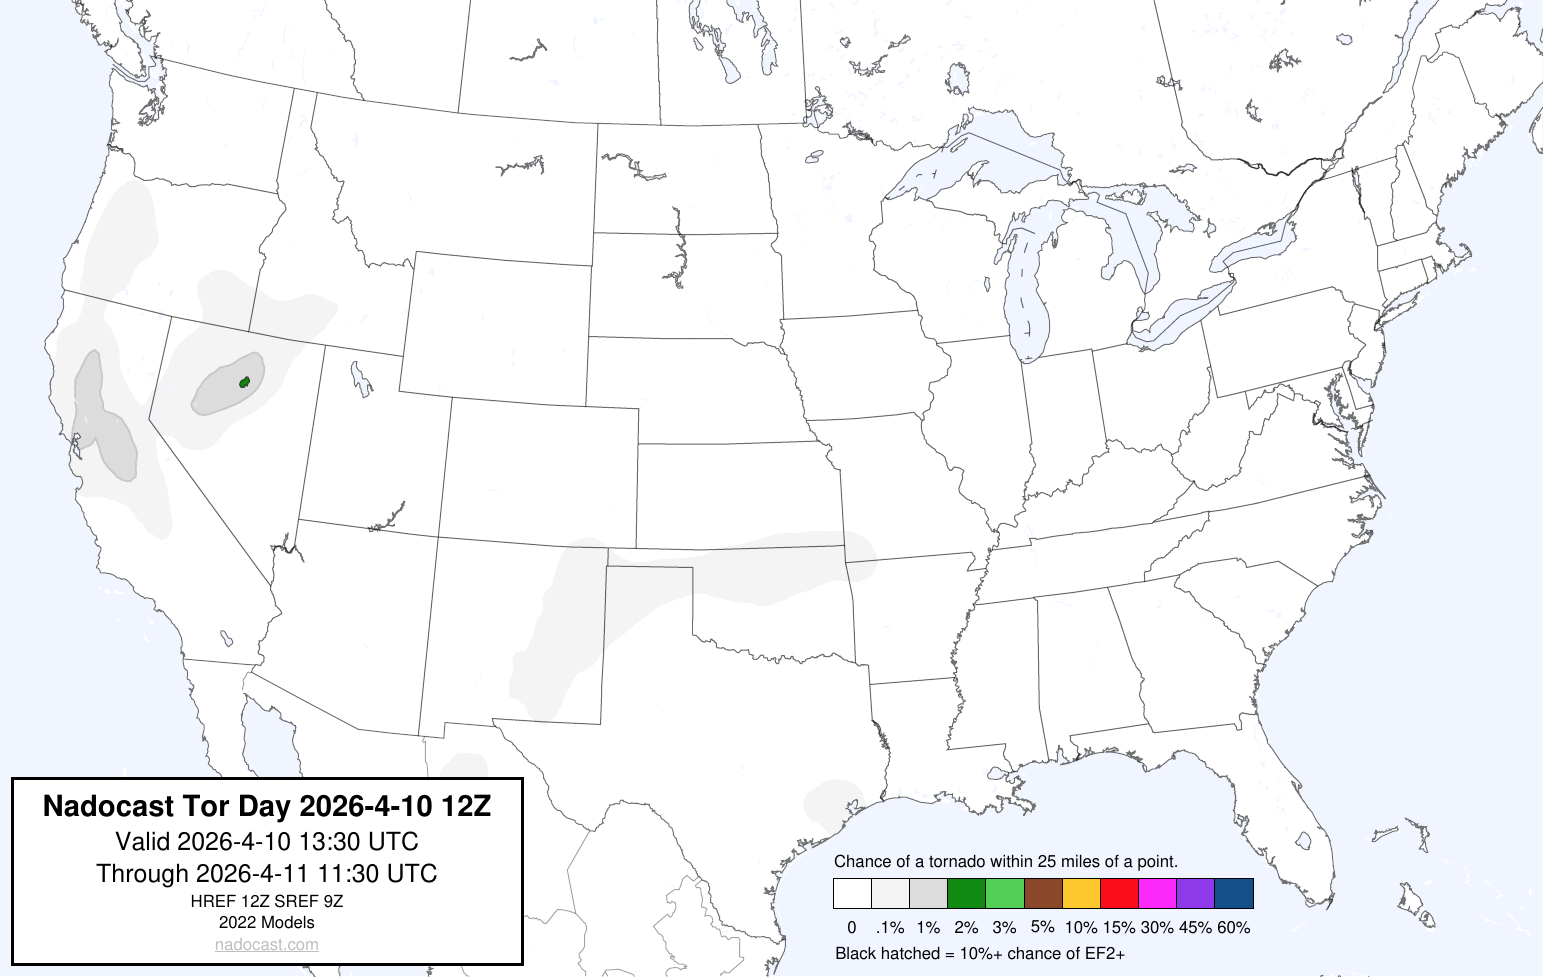
12Z NADOCAST SIGTOR PROBABILITY 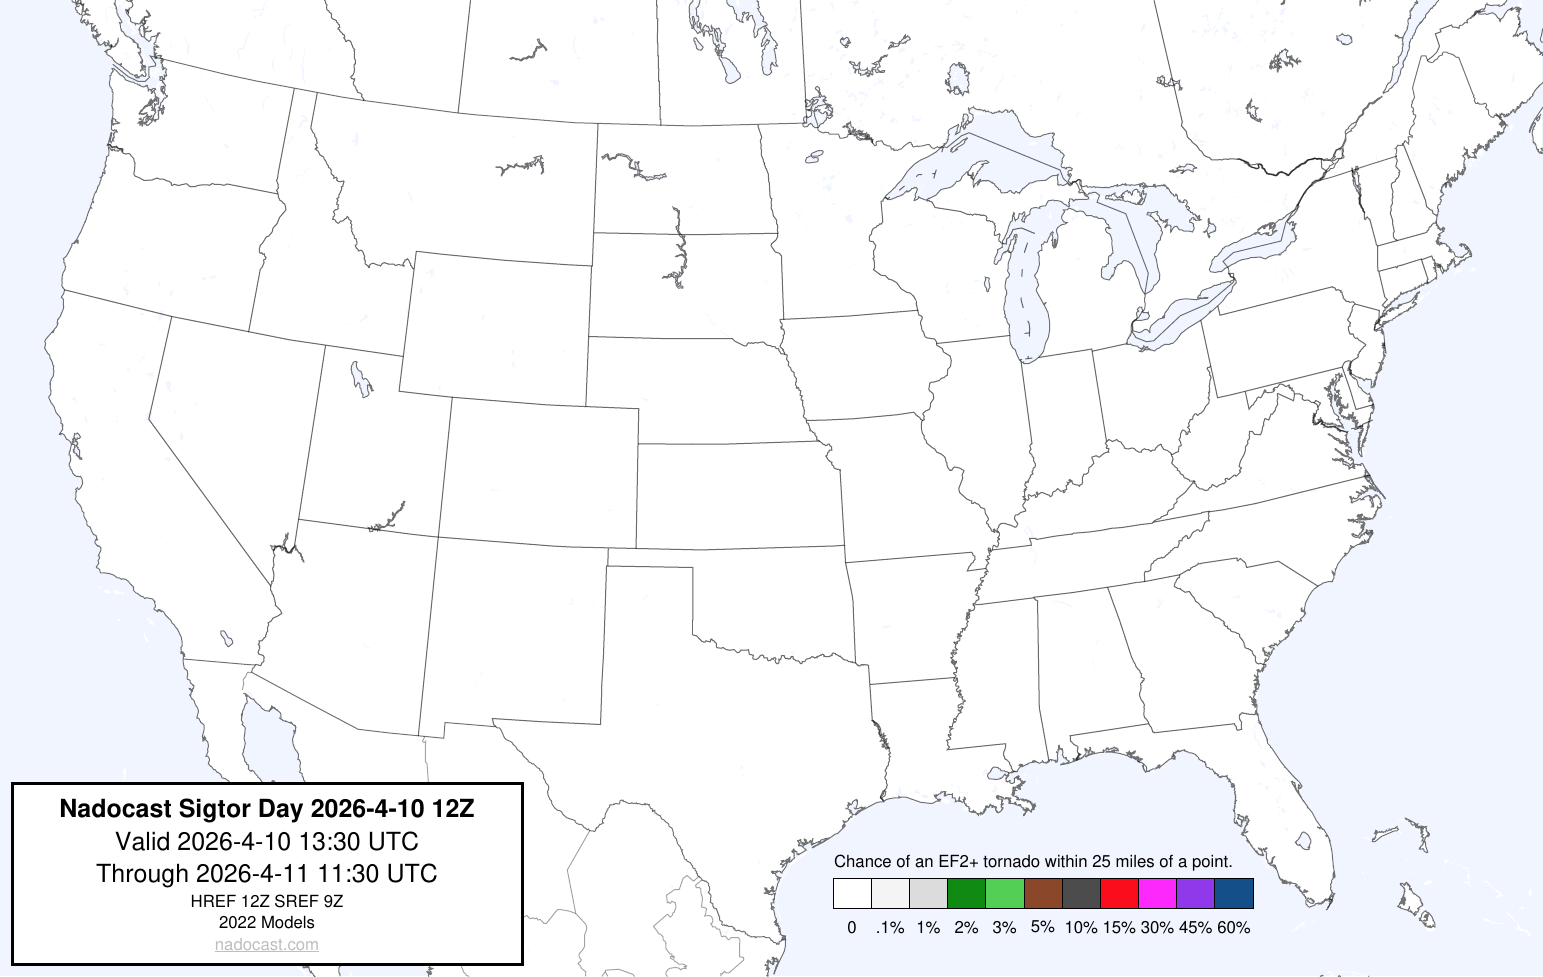
12Z NADOCAST HAIL PROBABILITY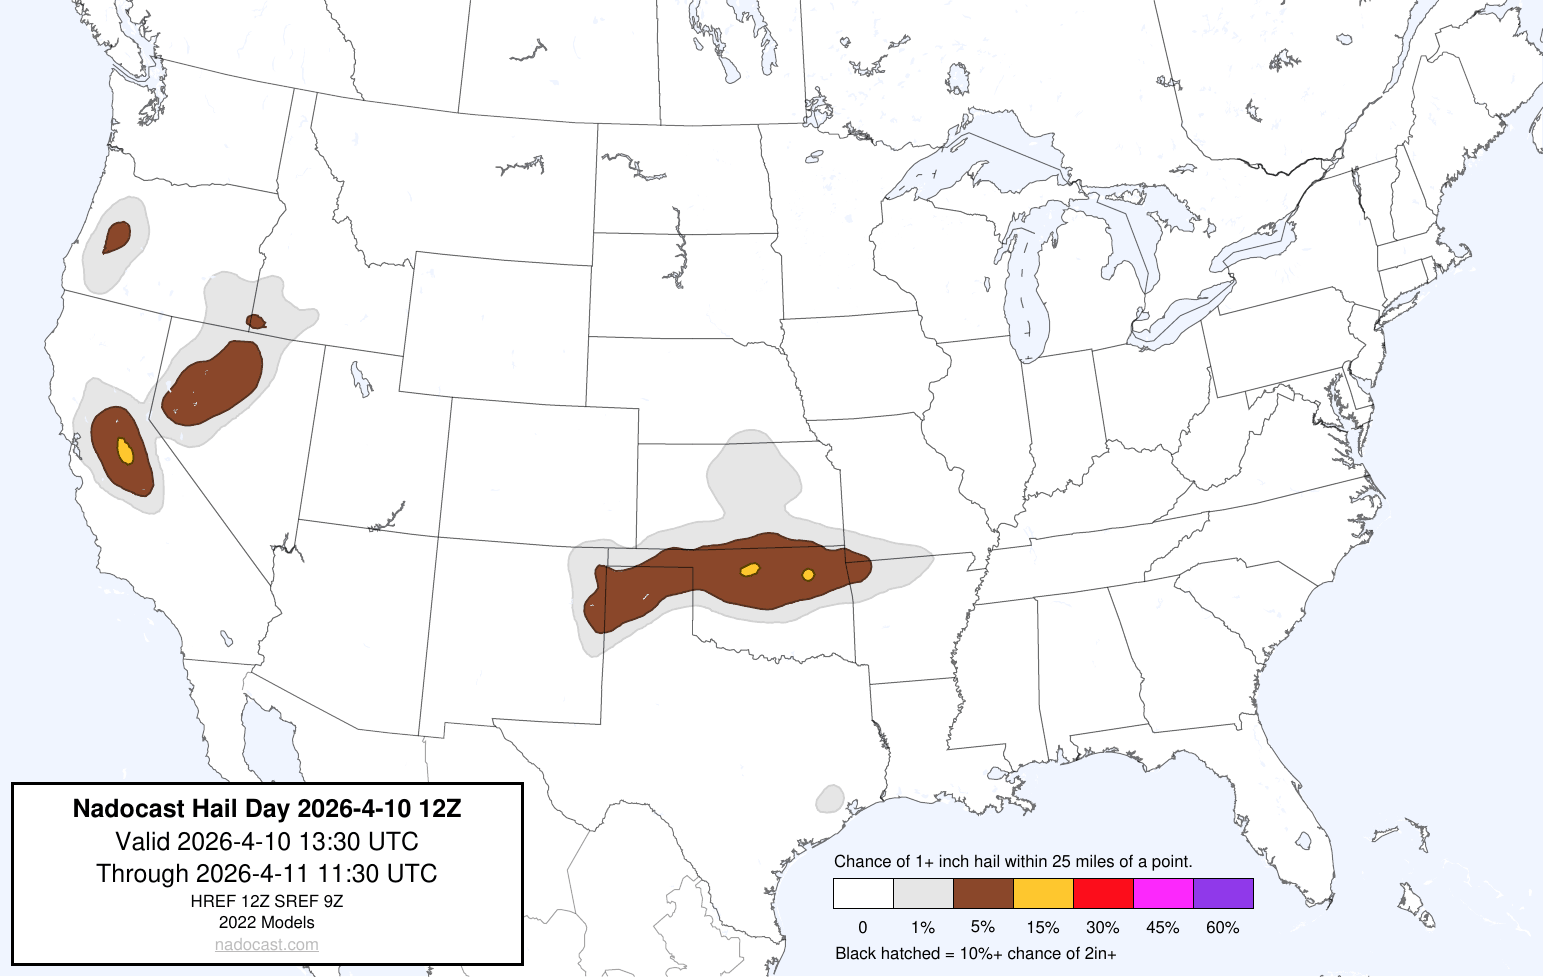
12Z NADOCAST SIGHAIL PROBABILITY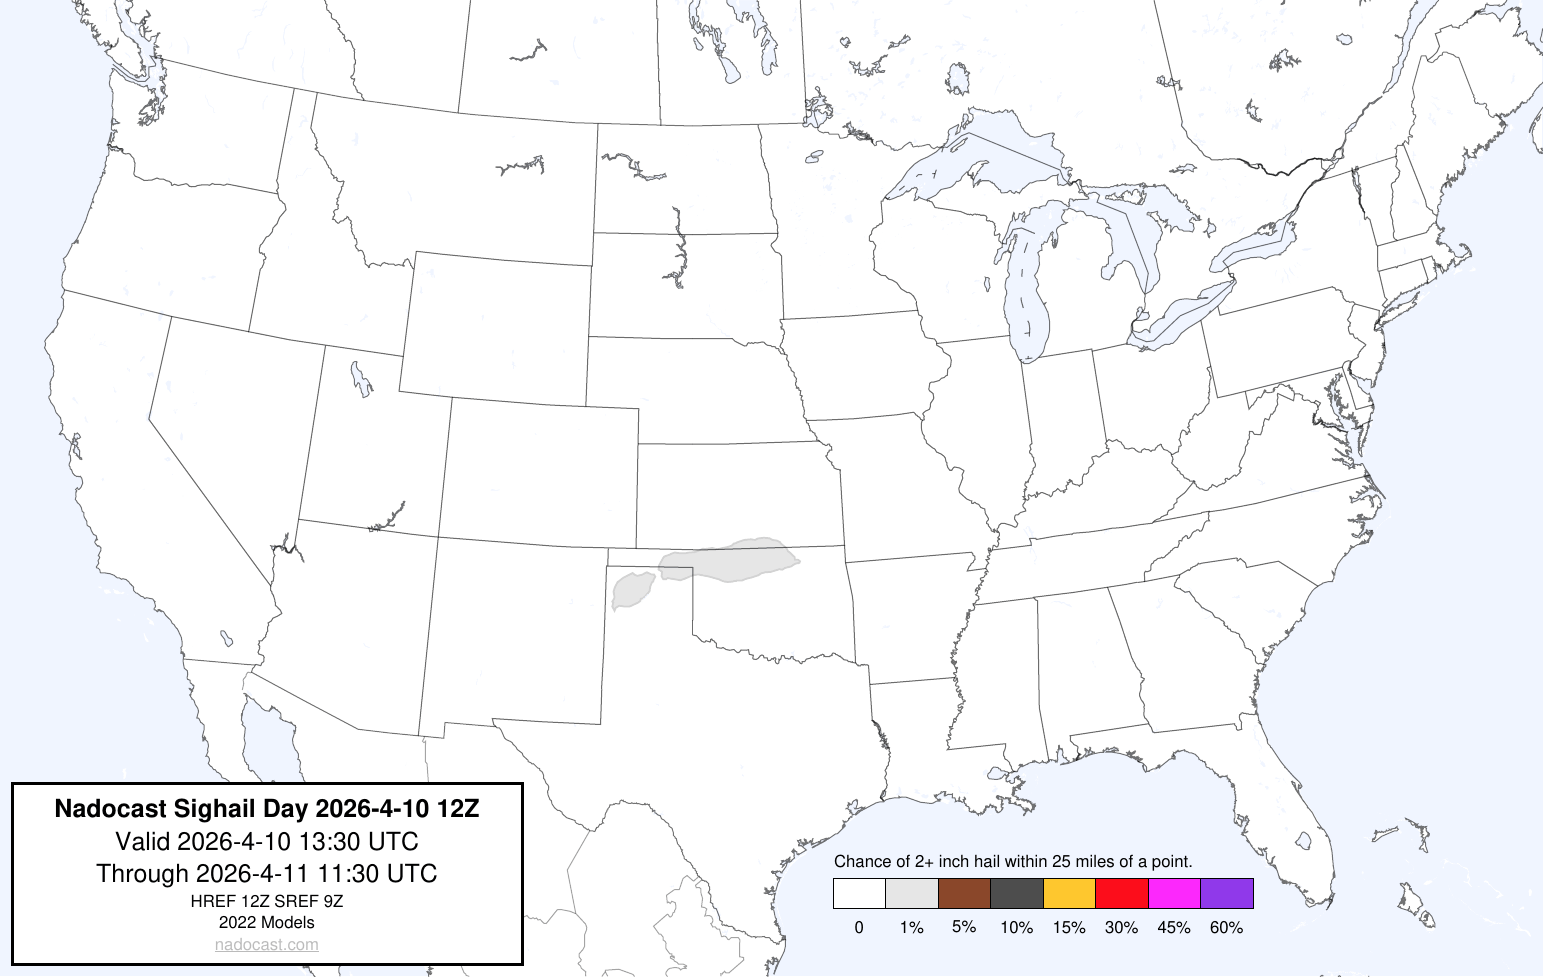
Based on my analysis of severe weather indices, the forecast calls for a marginally to moderately unstable atmosphere at the moment. Indices and current outlook maps indicate the main severe weather threat to be the probability for some isolated large hail and localized severe gusts, with the majority of maximum values located over central OK.
CAPE VALUES FORECAST
DEW POINT FORECAST
Based on analysis of model animations, the current outlook, and analysis of indices, the strongest convection and indices should occur by late afternoon, through the evening, with current animations indicating the strongest between 4:00 P.M. – 6:00 P.M. CDT.
Indices were analyzed from the NAM 3KM, CIPS DETERMINISTIC, and SPC SREF model guidance.
REGARDING EHI VALUES: While EHI values are calculated utilizing MLCAPE and 0 – 3 km SRH values (MLCAPE x 0 – 3 km SRH /160,000), the highest SRH values do not always fall within ample, highest MLCAPE values for the best probability of tornado activity. I utilize the SRH and MLCAPE values over the area that may have the most likely tornado potential. Maximum EHI values are calculated within the area(s) that have the greatest probability for tornado activity.
The following were the forecast parameters and indices analyzed this morning. Bear in mind, indices recorded below are for the time of peak intensity. Some indices meanings are posted below the indices themselves, and the NWS page containing a more extensive explanation can be accessed further on in the synopsis:
SBCAPE: 500 – 2500 j/kg-1
MLCAPE: 250 – 2000 j/kg-1
MUCAPE: 500 – 2500 j/kg-1
SRH 0 -1 km: 100 – 300 m2/s2
SRH 0 -3 km: 100 – 500 m2/s2
SRH EFFECTIVE: 50 – 150 m2/s2
L. I.: -1 to -7
SCP: 1 – 6
STP: 0.1 – 0.5
0 -6 km SHEAR: 30 kts – 40 kts
EFF. SHEAR: 30 kts – 35 kts
MID LEVEL LAPSE RATE: 6.5C – 8.5C
DEWPOINT: 41F – 66F
EHI: 0.8 – 1.3
TOTAL TOTALS INDEX: 53C
K INDEX: 25C – 36C
SWEAT INDEX: 365 – 415
THOMPSON INDEX: 26 – 44
CRAVEN – BROOKS INDEX: 10,000 – 20,000
The following are some severe weather parameters and indices explanations:
CAPE 
ENERGY HELICITY INDEX
K INDEX
TOTAL TOTALS INDEX
STORM RELATIVE HELICITY
LIFTED INDEX
SWEAT VALUES
THOMPSON INDEX
Craven SigSvr Parameter:
The simple product of 100mb MLCAPE and 0-6km magnitude of the vector difference (m/s; often referred to as “deep layer shear”) accounts for the compensation between instability and shear magnitude. Using a database of about 60,000 soundings, the majority of significant severe events (2+ inch hail, 65+ knot winds, F2+ tornadoes) occur when the product exceeds 20,000 m3/s3.
A little fact on SRH values and tornadoes from NOAA / NWS
Storm Relative Helicity (m2 s-2)
SRH (Storm Relative Helicity) is a measure of the potential for cyclonic updraft rotation in right-moving supercells, and is calculated for the lowest 1-km and 3-km layers above ground level. There is no clear threshold value for SRH when forecasting supercells, since the formation of supercells appears to be related more strongly to the deeper layer vertical shear. Larger values of 0-3-km SRH (greater than 250 m2 s-2) and 0-1-km SRH (greater than 100 m2 s-2), however, do suggest an increased threat of tornadoes with supercells. For SRH, larger values are generally better, but there are no clear thresholds between non-tornadic and significant tornadic supercells.
STP ( Significant Tornado Parameter) EXPLAINED:
A majority of significant tornadoes (EF2 or greater damage) have been associated with STP values greater than 1, while most non-tornadic supercells have been associated with values less than 1 in a large sample of RAP analysis proximity soundings.
SCP (Supercell Composite Parameter) EXPLAINED:
A multiple ingredient, composite index that includes effective storm-relative helicity (ESRH, based on Bunkers right supercell motion), most unstable parcel CAPE (muCAPE) and convective inhibition (muCIN), and effective bulk wind difference (EBWD). Each ingredient is normalized to supercell “threshold” values, and larger values of SCP denote greater “overlap” in the three supercell ingredients. Only positive values of SCP are displayed, which correspond to environments favoring right-moving (cyclonic) supercells.
The following are the SCP (Supercell Composite Parameter) and STP (Significant Tornado Parameter) forecast maps from the NAM 3KM model. Generally, the higher the values and brighter the color, indicates a greater probability of strong thunderstorm and / or tornadic activity over an area:
NAM 3KM SCP FORECAST 2:00 P.M. CDT APR. 10 – 11:00 P.M. CDT APR. 10
NAM 3KM STP FORECAST 2:00 P.M. CDT APR. 10 – 11:00 P.M. CDT APR. 10
NAM 3KM FORECAST RADAR ANIMATION 2:00 P.M. CDT APR. 10 – 11:00 P.M. CDT APR. 10
Please use the following maps, which should update automatically, for Mesoscale Discussions and Convective Watches. You may have to refresh your browser, or click on the graphics.
SPC MESOSCALE DISCUSSIONS (CLICK IMAGE FOR UPDATES)
SPC CONVECTIVE WATCHES (CLICK IMAGE FOR UPDATES)
I have provided the SPC homepage link below, so you may get the updated information regarding any changes to the outlook:
SPC HOMEPAGE
https://www.spc.noaa.gov/classic.html
The following sites will explain most of the severe weather and tornado values listed above, and will give you an idea of what to expect:
ENVIRONMENTAL INDICES AND PARAMETERS NWS
https://www.weather.gov/lmk/indices
THE WEATHER PREDICTION
http://www.theweatherprediction.com/severe/indices/
The following links will connect you to the Excessive Rainfall probabilities and River Flood Outlook:
EXCESSIVE RAINFALL
https://www.wpc.ncep.noaa.gov/qpf/excessive_rainfall_outlook_ero.php
SIGNIFICANT RIVER FLOOD OUTLOOK
https://www.wpc.ncep.noaa.gov/nationalfloodoutlook/index.html
The following NWS Watch / Warning map will provide local NWS information for your area. Click the image, then once it refreshes, click on your area of interest to view any forecasts, special weather statements, hazards or advisories for your area.
IF A TORNADO WARNING IS ISSUED FOR YOUR AREA…SEEK STURDY AND SAFE SHELTER IMMEDIATELY!
NWS WATCH / WARNING DISPLAY (LINKED…CLICK MAP, THEN YOUR AREA)
NWS DOPPLER RADAR LOOP (LINKED, CLICK RADAR MAP)
RAP RADAR (CLICK IMAGE THEN GO TO LOOP DURATION AND PICK LENGTH OF LOOP, THEN CLICK RADAR SITE)
WUNDERGROUND RADAR SUMMARY MAP (CLICK FOR UPDATES)
PRECIPITATION TYPE (CLICK TO ACCESS ANIMATION FEATURE)
CARIBBEAN RADAR (CLICK IMAGE TO ACCESS ANIMATION)
You may direct any questions by contacting me personally, ANYTIME, at: [email protected]
Have a blessed day!
T. F. “STORM” WALSH III
GMCS, USCG (ret)
METEOROLOGIST / HURRICANE SPECIALIST /SEVERE WEATHER SPECIALIST


 English (US) ·
  French (CA) ·