
 2 months ago
381
2 months ago
381
PROTECT YOUR DNA WITH QUANTUM TECHNOLOGY
Orgo-Life the new way to the future Advertising by AdpathwayDisclaimer: This site is not affiliated with the National Hurricane Center, Hurricane Hunters, Storm Prediction Center, or National Weather Service. ALL forecasts herein are the result of my analysis, (to which you will see me at times, insert excerpts from various agencies due to the nature of the importance of the information) and I am solely responsible for the content. As ALWAYS, follow the National Hurricane Center, National Weather Service, and your local Emergency Management officials for emergency decisions. In addition, this is strictly a FORECAST OFFICE. I CANNOT make decisions regarding travel plans, etc. My purpose, is to provide you the information, based solely on information I analyze, and the accuracy of the information at hand of the time of analysis, so you may make informed decisions.
(T. F. “Storm” Walsh)
For those who have donated to my site, your help has been greatly appreciated. If you are not aware, donations to my site help pay for subscriptions to sites I use as well as software updates, which provide all the models and information used in my forecasts. To donate, please click the DONATE button to the right side of the page, or on the graphic of the dog. Any help you provide is immensely appreciated!
DONATIONS ACCEPTED AND APPRECIATED


I will reiterate, my forecasts are based on the available information at the time of analysis, and are only as accurate as the information analyzed and the solutions provided.
Good day everyone!
The forecast center is closed on Sunday’s. Please visit this site on Sunday in order to access SPC products for any severe weather threat.
The Storm Prediction Center indicates the risk for severe weather Tue. and Wed., indicating the probability for a SLIGHT risk for Tue. and MARGINAL risk for Wed. ALL graphics are linked to their outlook:
DAY 2 OUTLOOK:
DAY 3 OUTLOOK:
SPC DAY 4 – 8 OUTLOOK: (LINKED TO OUTLOOK)
For a little clarity on the “new” BLACK HATCHED areas, the SPC has added them as CIG or Conditional Intensity Groups. The higher the category, the stronger that particular weather risk is forecast to be. The following links explain this new feature, along with a video from the SPC:
NWS
https://www.weather.gov/news/262402-spc
SPC
https://origin-west-www-spc.woc.noaa.gov/about/outlooks/#:~:text=The%20SPC%20will%20represent%20these%20intensity%20forecasts,product%2C%20replacing%20the%20current%20operational%20’SIGN’%20label.
IF 1300Z SPC DAY 1 outlook graphics are utilized, please check the SPC site for any updates to the outline risks when they are issued. 1630Z updates post at approximately 12:30 p.m.
CURRENT DAY1 SEVERE WEATHER OUTLOOK
The Storm Prediction Center (SPC) has issued a MODERATE risk for severe thunderstorms in the current DAY1 Outlook: ACROSS PARTS OF MISSOURI INTO ILLINOIS…
…SPC SUMMARY…
Numerous severe thunderstorms are expected from the mid Mississippi/lower Ohio Valleys into the Mid-South through this evening, with a threat for multiple strong to intense tornadoes (EF-3+), widespread severe/damaging wind gusts, and scattered large to very large hail.
1300Z SPC DAY 1 SEVERE THUNDERSTORM OUTLOOK (LINKED FOR OUTLOOK TEXT)
TORNADO PROBABILITY
Probability of a tornado within 25 miles of a point. Hatched area: a 10% or greater probability of EF2 – EF5 tornadoes within 25 miles of a point
HAIL PROBABILITY
Probability of one inch diameter hail or larger within 25 miles of a point. Hatched area: a 10% or greater probability of 2.0 inch diameter or larger hail within 25 miles of a point
DAMAGING THUNDERSTORM WIND PROBABILITY
Probability of damaging thunderstorm winds or wind gusts of 50 knots or higher within 25 miles of a point. Hatched area: a 10% or greater probability of 65 kt+ winds within 25 miles of a point
CSU – MLP DAY 1 AND 2 FORECAST PROBABILITIES (CLICK FOR LARGER IMAGE) 
NSSL ML DAY 1 PROBABILITY
CSU – MLP 6 PANEL PROBABILITIES DAY 3 – DAY 8 (CLICK FOR LARGER IMAGE)

DAY 1 PROBABILITY CONVERSION TABLE
SPC DISCUSSION EXCERPT:
…Mid Mississippi Valley/Midwest into the Mid-South/Lower Mississippi Valley…
An active severe weather day is forecast for much of the mid MS Valley/lower OH Valleys into the Mid-South. Ongoing thunderstorms this morning complicate the overall scenario to some extent, but a very favorable corridor for intense supercells and strong tornadoes is apparent this afternoon/evening across parts of MO into IL, where a Moderate Risk (Level 4 of 5) has been introduced.
Current expectations are for the greatest severe risk to focus south of these morning thunderstorms. A mid/upper-level trough will eject northeastward from the northern/central Plains into the Midwest and mid MS Valley through the period. Low-level mass response will encourage the primary surface low to consolidate across MN/WI by this evening, with an effective warm front delineated by the morning convection. Aided by daytime heating and steep mid-level lapse rates, a moderately to strongly unstable airmass is expected to be in place by early to mid afternoon across much of central MO/southern IL southward into the Mid-South and lower MS Valley.
Strengthening west-southwesterly flow aloft associated with a 50-70 kt mid-level jet will overspread much of the warm sector by peak heating, and a 35-45 kt south-southwesterly low-level jet will both provide ample low-level and deep-layer shear to support supercells. Initially discrete surface-based development appears likely to occur by 19-21Z across the mid MS Valley/Mid-South ahead of the surface cold front, and perhaps along weak low-level confluence zones in the open warm sector.
These supercells will exist in a very favorable environment for tornadoes through the afternoon and evening, and multiple strong to intense tornadoes (EF-2/3+) appear likely, especially from parts of MO into IL along/near the effective front. This strong tornado threat may also extend farther south into AR/TN, but confidence is somewhat lower with southward extent due to weaker large-scale forcing. Large to very large hail (2-3 inches in diameter) may also occur with any sustained supercells.
The following maps are from NADOCAST for tornado and hail probabilities. Click each image for a larger view.
12Z NADOCAST TORNADO PROBABILITY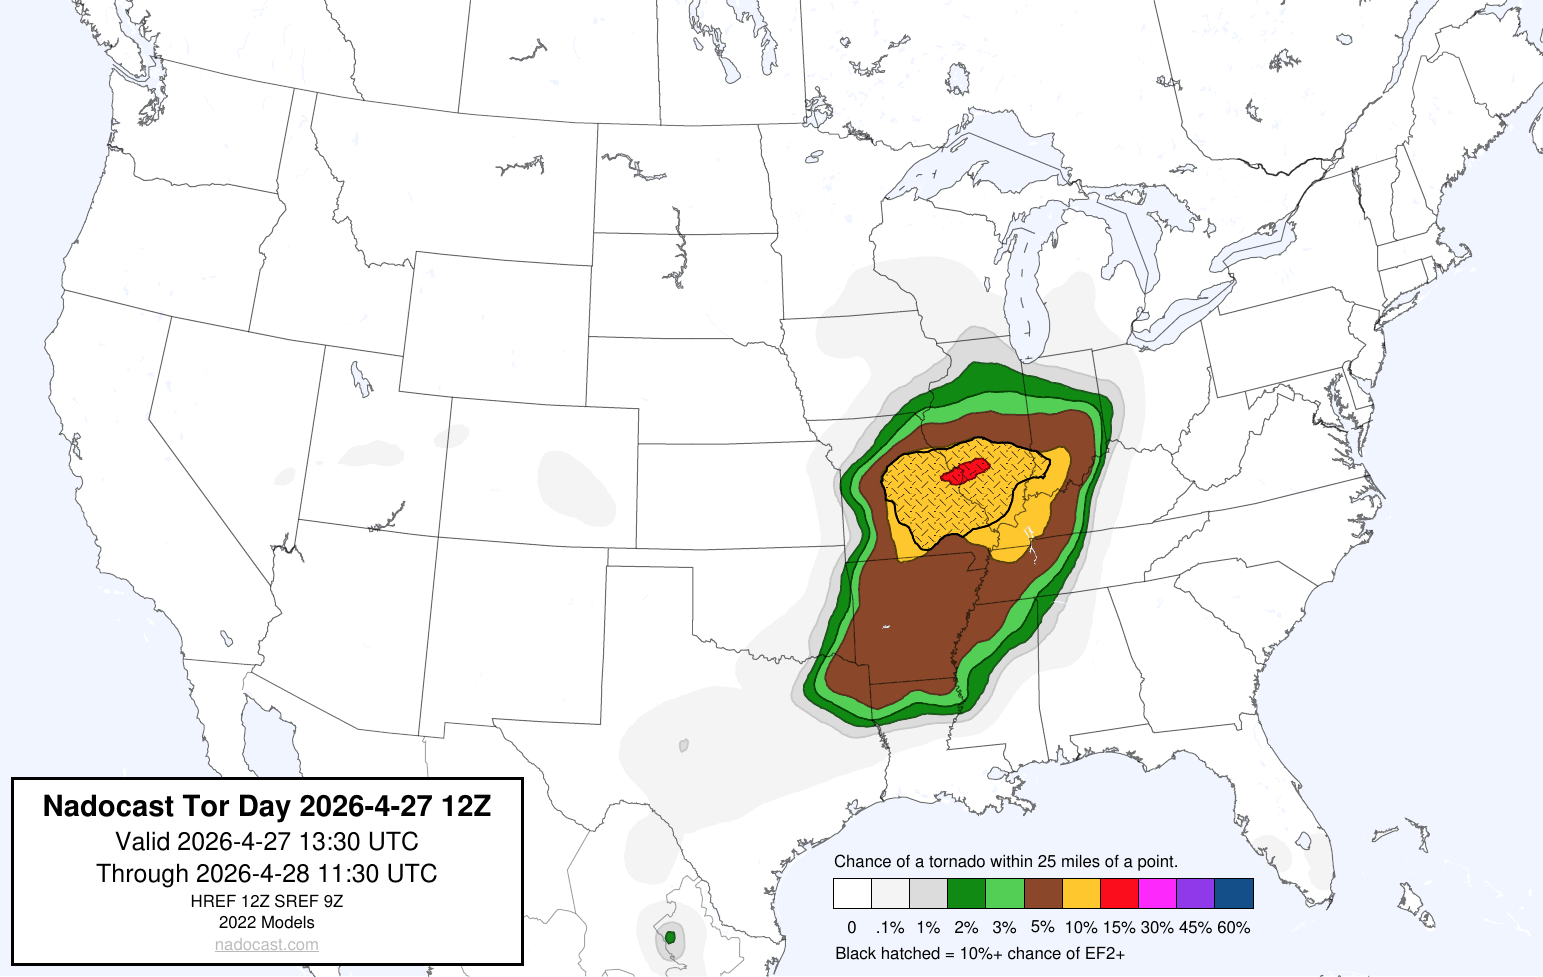
12Z NADOCAST SIGTOR PROBABILITY 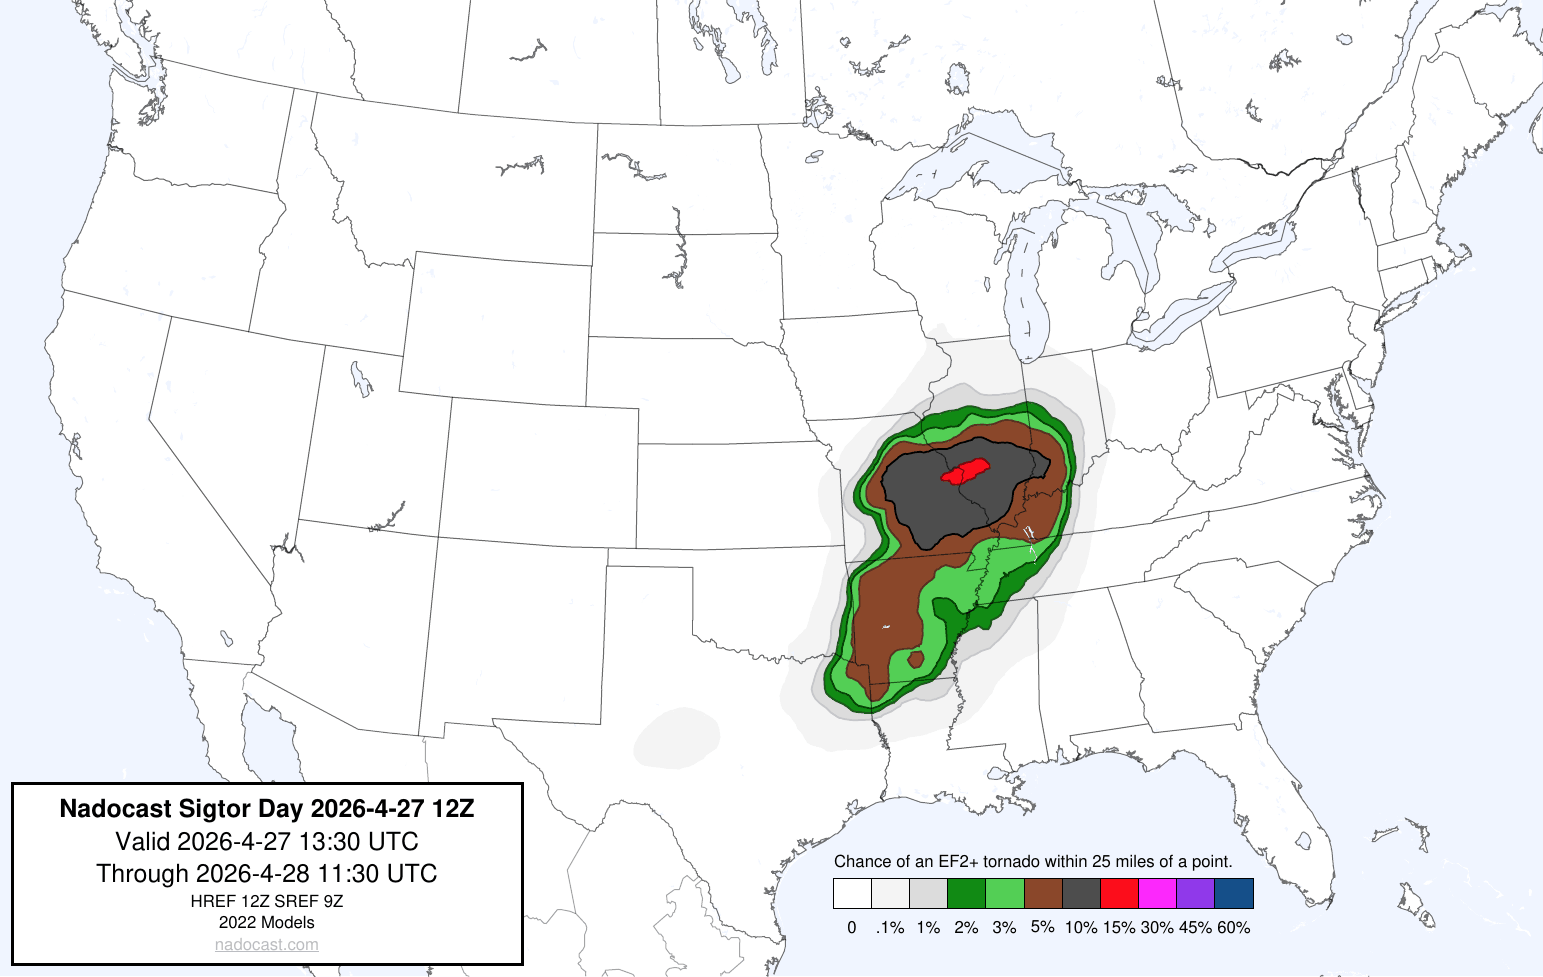
12Z NADOCAST HAIL PROBABILITY 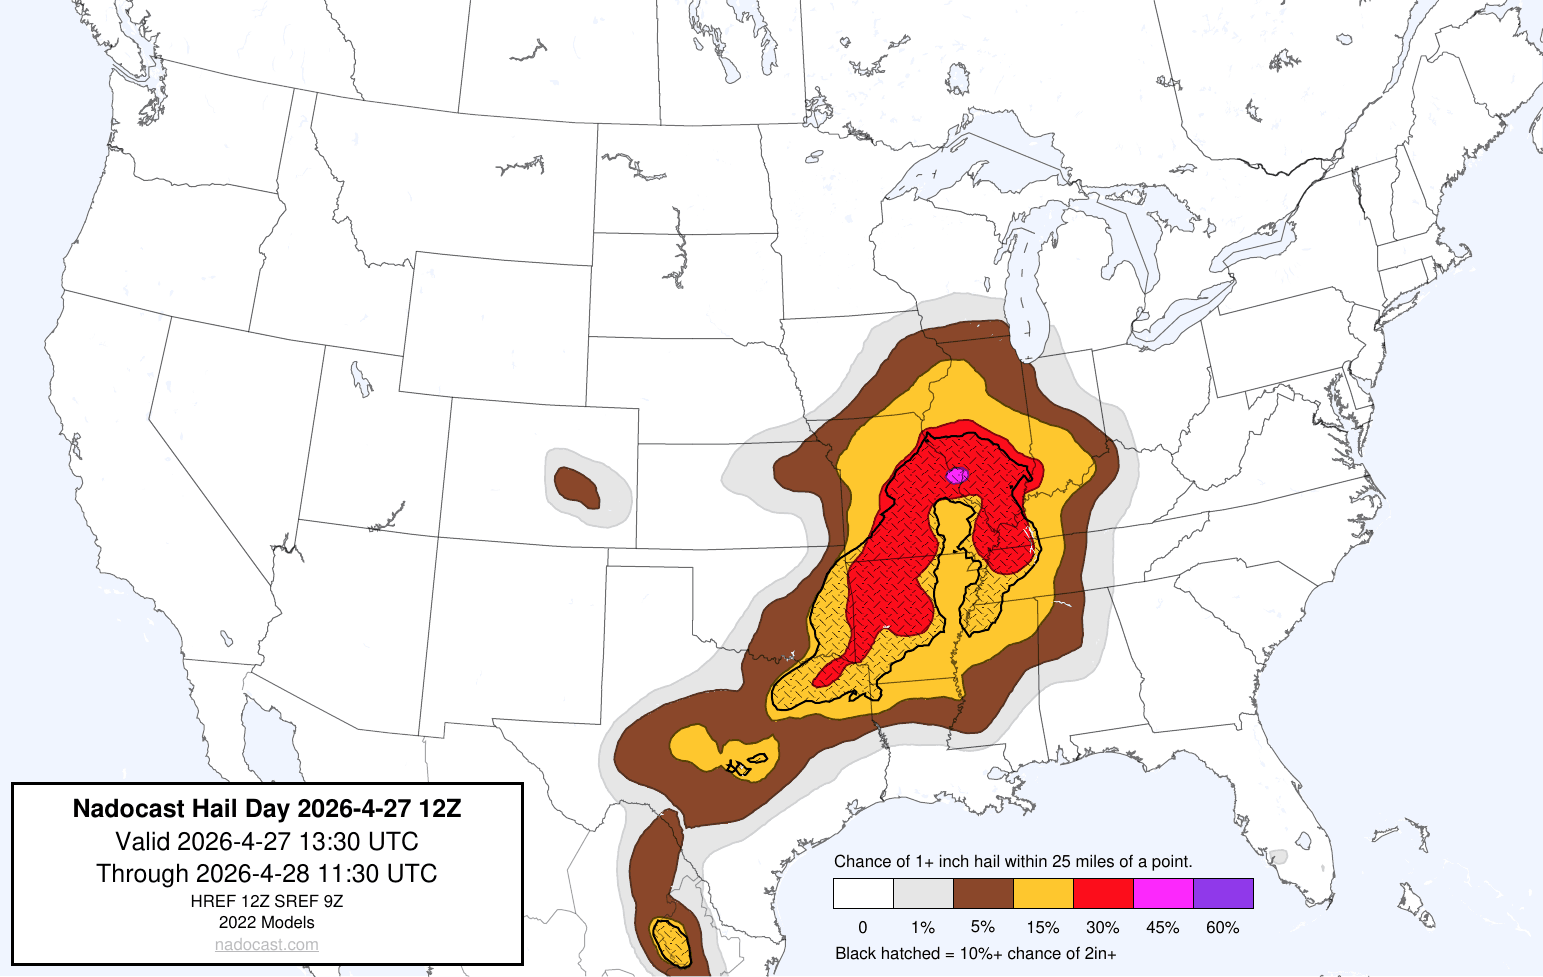
12Z NADOCAST SIGHAIL PROBABILITY 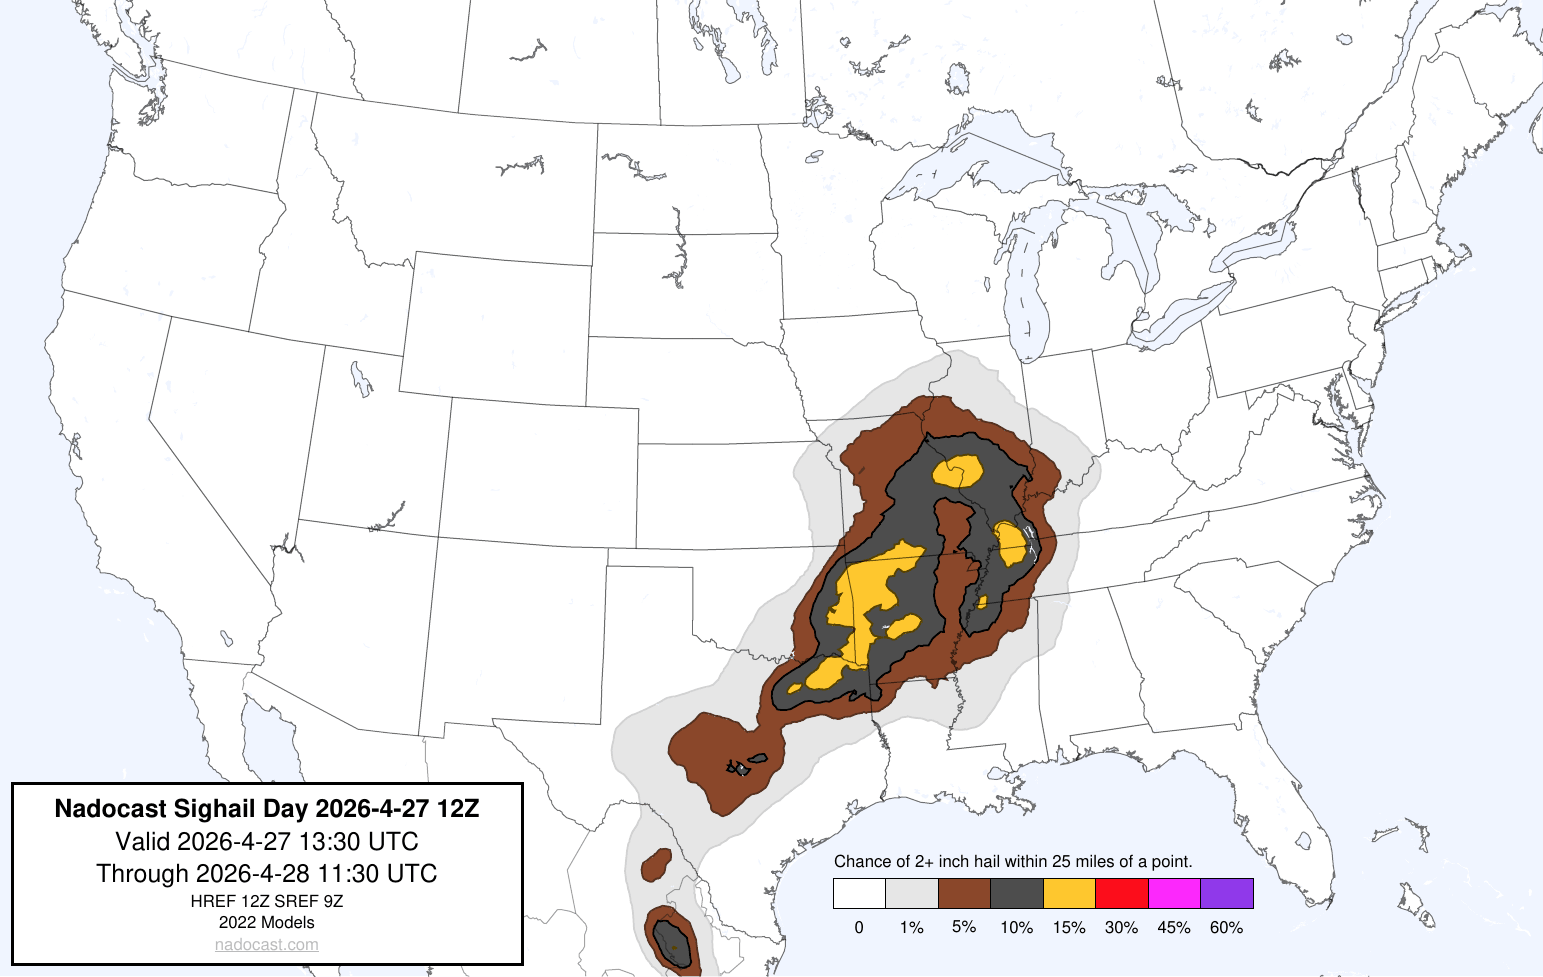
Severe storms were in progress this morning. Based on my analysis this morning of the current forecast severe weather indices, the forecast calls for a very unstable to extremely unstable atmosphere within the MODERATE and ENHANCED risk 10% – 15% HATCHED TORNADO OUTLINES. The main severe risk as of analysis this morning appears to be a possibility of LARGE to isolated VERY LARGE hail, damaging thunderstorm winds / gusts, with the possibility of multiple STRONG to INTENSE TORNADOES (EF2 – EF3) and an ISOLATED (EF4 – EF5) over the 10% – 15% HATCHED TORNADO OUTLINES. This setup COULD produce a PDS (Particularly Dangerous Situation) and COULD warrant the issuance of a PDS TORNADO WATCH if certain conditions are able to come together.
Based on analysis of mainly model animations, the current outlook, and analysis of indices, the strongest convection and indices should occur approximately between early to mid afternoon through early evening, as re-development occurs. Please visit the SPC homepage via the link provided for any changes to the forecast today.
CAPE VALUES FORECAST
DEW POINT FORECAST
Indices were analyzed from the NAM 3KM, HRRR 3KM, CIPS DETERMINISTIC, and SPC SREF model guidance.
REGARDING EHI VALUES: While EHI values are calculated utilizing MLCAPE and 0 – 3 km SRH values (MLCAPE x 0 – 3 km SRH /160,000) for SUPERCELL development, and MLCAPE and 0 -1 km SRH for TORNADO development. The highest SRH values do not always fall within ample, highest MLCAPE values for the best probability of tornado activity. I utilize the SRH and MLCAPE values over the area that has the highest tornado risk potential. Maximum EHI values are calculated within the area(s) that have the greatest probability for tornado activity.
The following were the forecast parameters and indices analyzed this morning within the MODERATE and ENHANCED risk outlines over the 10% – 15% HATCHED TORNADO OUTLINES, with the strongest indices being located in those TORNADO outlines . Listed indices will always pertain to the area(s) located within the highest SPC risk outlines, based mainly on indices regarding a higher tornado potential, should multiple severe risk areas appear in the SPC forecast. Although certain indices may appear stronger on a forecast map, given the lack of other indices does not contribute to the overall severe risk. Bear in mind, MAXIMUM indices recorded below are for the time of peak intensity. Some indices meanings are posted below the indices themselves, and the NWS page containing a more extensive explanation can be accessed further on in the synopsis:
SBCAPE: 2500 – 4500 j/kg-1
MLCAPE: 2000 – 3500 j/kg-1
MUCAPE: 2500 – 4500 j/kg-1
SRH 0 -1 km: 175 – 350 m2/s2
SRH 0 -3 km: 250 – 450 m2/s2
SRH EFFECTIVE: 150 – 350 m2/s2
L. I.: -6 to -12
SCP: 8 – 32
STP: 0.7 – 6.4
0 -6 km SHEAR: 40 kts – 60 kts
EFF. SHEAR: 50 kts – 60 kts
MID LEVEL LAPSE RATE: 8.0C – 9.0C
DEWPOINT: 59F – 73F
SUPERCELL EHI : 5.5 – 9.8
TORNADIC EHI : 3.3 – 5.5
TOTAL TOTALS INDEX: 57C
K INDEX: 24C to 32C
SWEAT INDEX: 640 – 755
THOMPSON INDEX: 30 to 44
CRAVEN – BROOKS INDEX: 70,000 – 110,000
The following are some severe weather parameters and indices explanations:
CAPE 
ENERGY HELICITY INDEX
K INDEX
TOTAL TOTALS INDEX
STORM RELATIVE HELICITY
LIFTED INDEX
SWEAT VALUES
THOMPSON INDEX
Craven SigSvr Parameter:
The simple product of 100mb MLCAPE and 0-6km magnitude of the vector difference (m/s; often referred to as “deep layer shear”) accounts for the compensation between instability and shear magnitude. Using a database of about 60,000 soundings, the majority of significant severe events (2+ inch hail, 65+ knot winds, F2+ tornadoes) occur when the product exceeds 20,000 m3/s3.
A little fact on SRH values and tornadoes from NOAA / NWS
Storm Relative Helicity (m2 s-2)
SRH (Storm Relative Helicity) is a measure of the potential for cyclonic updraft rotation in right-moving supercells, and is calculated for the lowest 1-km and 3-km layers above ground level. There is no clear threshold value for SRH when forecasting supercells, since the formation of supercells appears to be related more strongly to the deeper layer vertical shear. Larger values of 0-3-km SRH (greater than 250 m2 s-2) and 0-1-km SRH (greater than 100 m2 s-2), however, do suggest an increased threat of tornadoes with supercells. For SRH, larger values are generally better, but there are no clear thresholds between non-tornadic and significant tornadic supercells.
STP ( Significant Tornado Parameter) EXPLAINED:
A majority of significant tornadoes (EF2 or greater damage) have been associated with STP values greater than 1, while most non-tornadic supercells have been associated with values less than 1 in a large sample of RAP analysis proximity soundings.
SCP (Supercell Composite Parameter) EXPLAINED:
A multiple ingredient, composite index that includes effective storm-relative helicity (ESRH, based on Bunkers right supercell motion), most unstable parcel CAPE (muCAPE) and convective inhibition (muCIN), and effective bulk wind difference (EBWD). Each ingredient is normalized to supercell “threshold” values, and larger values of SCP denote greater “overlap” in the three supercell ingredients. Only positive values of SCP are displayed, which correspond to environments favoring right-moving (cyclonic) supercells.
The following are the SCP (Supercell Composite Parameter) and STP (Significant Tornado Parameter) forecast maps from the NAM 3KM model. Generally, the higher the values and brighter the color, indicates a greater probability of strong thunderstorm and / or tornadic activity over an area:
NAM 3KM SCP FORECAST 1:00 P.M. CDT APR. 27 – 11:00 P.M. CDT APR. 27
NAM 3KM STP FORECAST 1:00 P.M. CDT APR. 27 – 11:00 P.M. CDT APR. 27
HRRR 3KM RADAR SIMULATION 1:00 P.M. CDT APR. 27 – 11:00 P.M. CDT APR. 27
Please use the following maps, which should update automatically, for Mesoscale Discussions and Convective Watches. You may have to refresh your browser, or click on the graphics. I have provided the SPC homepage link below, so you may get the updated information regarding any changes to the outlook:
https://www.spc.noaa.gov/classic.html
SPC MESOSCALE DISCUSSIONS (CLICK IMAGE FOR UPDATES)
SPC CONVECTIVE WATCHES (CLICK IMAGE FOR UPDATES)
The following sites will explain most of the severe weather and tornado values listed above, and will give you an idea of what to expect:
ENVIRONMENTAL INDICES AND PARAMETERS NWS
https://www.weather.gov/lmk/indices
THE WEATHER PREDICTION
http://www.theweatherprediction.com/severe/indices/
The following links will connect you to the Excessive Rainfall probabilities and River Flood Outlook:
EXCESSIVE RAINFALL
https://www.wpc.ncep.noaa.gov/qpf/excessive_rainfall_outlook_ero.php
SIGNIFICANT RIVER FLOOD OUTLOOK
https://www.wpc.ncep.noaa.gov/nationalfloodoutlook/index.html
The following NWS Watch / Warning map will provide local NWS information for your area. Click the image, then once it refreshes, click on your area of interest to view forecasts, any special weather statements, hazards or advisories for your area.
IF A TORNADO WARNING IS ISSUED FOR YOUR AREA…SEEK STURDY AND SAFE SHELTER IMMEDIATELY!
NWS WATCH / WARNING DISPLAY (LINKED…CLICK MAP, THEN YOUR AREA)
NWS DOPPLER RADAR LOOP (LINKED, CLICK RADAR MAP)
RAP RADAR (CLICK IMAGE THEN GO TO LOOP DURATION AND PICK LENGTH OF LOOP, THEN CLICK RADAR SITE)
WUNDERGROUND RADAR SUMMARY MAP (CLICK FOR UPDATES)
PRECIPITATION TYPE (CLICK TO ACCESS ANIMATION FEATURE)
CARIBBEAN RADAR (CLICK IMAGE TO ACCESS ANIMATION)
You may direct any questions by contacting me personally, ANYTIME, at: [email protected]
Have a blessed day!
T. F. “STORM” WALSH III
GMCS, USCG (ret)
METEOROLOGIST / HURRICANE SPECIALIST /SEVERE WEATHER SPECIALIST


 English (US) ·
  French (CA) ·