
 5 months ago
868
5 months ago
868
PROTECT YOUR DNA WITH QUANTUM TECHNOLOGY
Orgo-Life the new way to the future Advertising by AdpathwayDisclaimer: This site is not affiliated with the National Hurricane Center, Hurricane Hunters, Storm Prediction Center, or National Weather Service. ALL forecasts herein are the result of my analysis, (to which you will see me at times, insert excerpts from various agencies due to the nature of the importance of the information) and I am solely responsible for the content. As ALWAYS, follow the National Hurricane Center, National Weather Service, and your local Emergency Management officials for emergency decisions. In addition, this is strictly a FORECAST OFFICE. I CANNOT make decisions regarding travel plans, etc. My purpose, is to provide you the information, based solely on information I analyze, and the accuracy of the information at hand of the time of analysis, so you may make informed decisions.
(T. F. “Storm” Walsh)
For those who have donated to my site, your help has been greatly appreciated. If you are not aware, donations to my site help pay for subscriptions to sites I use as well as software updates, which provide all the models and information used in my forecasts. To donate, please click the DONATE button to the right side of the page, or on the graphic of the dog. Any help you provide is immensely appreciated!
DONATIONS ACCEPTED AND APPRECIATED


I will reiterate, my forecasts are based on the available information at the time of analysis, and are only as accurate as the information analyzed and the solutions provided.
Good evening everyone!
The following is the list of storm names for the 2025 Atlantic Hurricane Season:
Andrea Barry Chantal Dexter Erin Fernand Gabrielle Humberto Imelda Jerry
Karen Lorenzo Melissa Nestor Olga Pablo Rebekah Sebastien Tanya Van Wendy
As we go through the season and as storms are named, I will mark them in RED to indicate active, or already named systems.
Based on my analysis of CURRENT forecast information from various global and climate models, it appears at the moment the 2025 Atlantic Hurricane Season COULD be an “average” to “slightly above average”season. As always, this forecast is subject to change as forecast models will continue to update between now and June 01 on a monthly basis. Last season, the climate modeling solutions did not come to fruition as expected, hence the lack of the projected hyperactivity. However, as it stands with the available information, the forecast for average to slightly above is what I currently expect. I will reiterate once again, when I post my pre-season, and final seasonal forecasts, the totals are based on BONA FIDE storms, not some of the “ham sandwiches” we saw named in previous seasons . I’m speaking of storms that meet the NWS/NHC criteria. First, the system has to start out as a Tropical Disturbance, and as it strengthens, it becomes a depression, storm, and then hurricane:
Tropical Disturbance:
A discrete tropical weather system of apparently organized convection — generally 100 to 300 nmi in diameter — originating in the tropics or subtropics, having a non-frontal migratory character, and maintaining its identity for 24 hours or more. It may or may not be associated with a detectable perturbation of the wind field.
Please note some of the “key” features: apparently organized convection, non-frontal migratory character, and maintaining its identity for 24 hours. In some prior seasons, we saw naked swirls being called depressions, and all of a sudden, if a thunderstorm popped up, or an area of deep convection fired up, mainly on the edge of the center, it got named. This does not meet the criteria of apparently organized deep convection, maintaining its identity for 24 hours. They also named systems that had a frontal system still attached, or decaying front through the center of the system. Keep this in mind if you are following this site and the active storms…look for the criteria.
The following is my PRE-SEASON outlook forecast for the upcoming 2025 Atlantic Hurricane Season. These totals are based on current climate model information of various parameters, and are almost sure to change, as climate modeling continues to update between now and June 01, 2025:
STORM W PRE-SEASON FORECAST
TOTAL NAMED STORMS: 15 – 18
TOTAL HURRICANES : 7 – 9
MAJOR HURRICANES: 2 – 3
AVERAGE HURRICANE SEASON:
TOTAL NAMED STORMS: 14
TOTAL HURRICANES: 7
MAJOR HURRICANES: 3
Forecast parameters used in this synopsis include the following:
1.) CLIMATE MODEL ENSO PLUME FORECASTS
2.) SST ANOMALY FORECAST
3.) IOD (Indian Ocean Dipole) FORECAST
4.) WIND SHEAR FORECAST
5.) ONI (Oceanic Nino Index) FORECAST TEMPERATURES AND TRENDS
6.) AVERAGING OF CHOSEN ANALOG YEARS BASED ON CPC ONI HISTORY
7.) Past and current MEI (Multivariate ENSO Index) information
Based on analysis of updated forecast ENSO plumes from global and climate modeling, and updated ONI forecast temperatures and trends, the majority of models seem to indicate the onset of “NEUTRAL” to “NEUTRAL – COLD BIAS” ENSO conditions. The outlier in the ENSO plumes forecast was the ECMWF which indicates NEUTRAL – WARM BIAS to WEAK El Nino conditions, which brought about the 2018 hurricane season as one of the analogs. As a rule of thumb, the cooler NINO 3.4 becomes, the more favorable conditions become over the Atlantic for storm development, with the opposite effect of a warmer NINO 3.4 region. The SOI or Southern Oscillation Index currently indicates the atmosphere is in a “La Nina” ENSO state. When this graph is in “positive” territory, it indicates La Nina conditions in the atmosphere, while “negative territory tends to indicate El Nino conditions in the atmosphere. Typically, the lag time is about 2 months. This means for the atmosphere to be declared in either El Nino or La Nina state, the graph has to be either +7 or -7 for at least 2 months. Here is a little explanation from the BOM:
Sustained positive values of the SOI above +7 typically indicate La Niña, while sustained negative values below −7 typically indicate El Niño. Values between +7 and −7 generally indicate neutral conditions.
Unfortunately, there have been some technical issues with the SOI graph which has not update in a week, so I had to use the current posted chart.
SOI CHART FOR FEBRUARY 2025

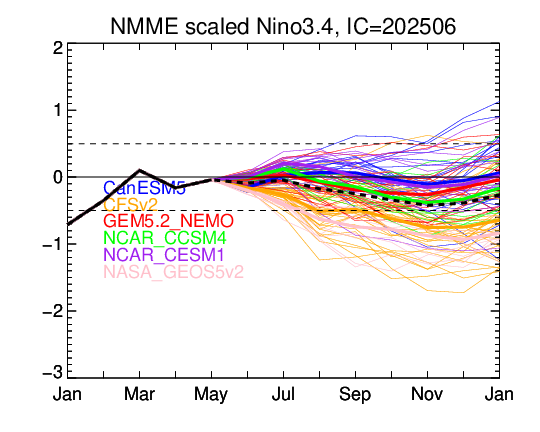
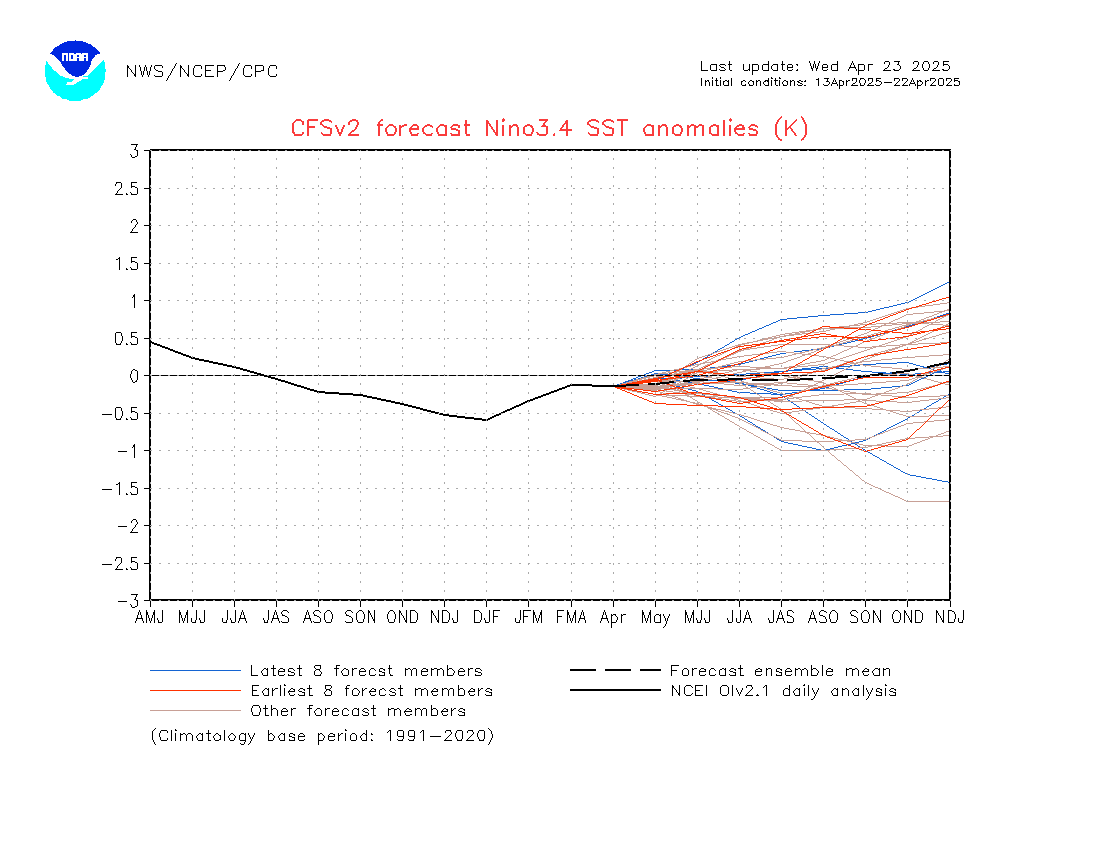
The following are the current forecast ENSO or NINO 3.4 forecast plumes for the initial analysis:
CLIMATE NMME MODEL NINO PLUMES FORECAST GRAPHS (CLICK IMAGE FOR MORE MODELS):
CFSv2 (CLICK FOR LARGER IMAGE)
NASA GEOS (CLICK FOR LARGER IMAGE)

ECMWF

IRI / CPC (LINKED)

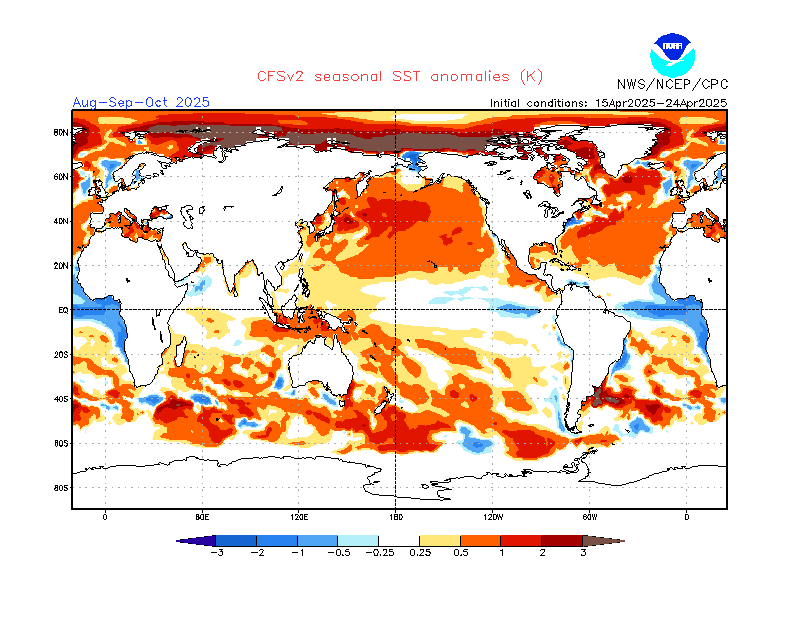
The following SST anomalies forecast is from the CFSv2 climate model and NMME model, and currently indicates the forecast neutral pattern:
CFSv2 SST ANOMALIES FORECAST JUN – AUG (LINKED)
NMME SST ANOMALIES FORECAST (CLICK FOR MORE IMAGES)

ECMWF SEASONAL ANOMALIES FORECAST

CURRENT SST ANOMALIES

You’ll note in the SST anomalies forecast maps, the majority of the modeling shows pretty much “neutral” conditions in the ENSO 3.4 area, with the exception of the ECMWF, indicating possible “neutral-warm biased” conditions. Most of the climate modeling indicates the Atlantic to be warmer over the sub-tropical portion vice the MDR. This is the setup we experienced last season, so it may be possible we see somewhat of a repeat pattern of where we had a quiet period near and during the climatological “peak” due to extensive dry air in the mid levels most of last season. Another condition noted is, models currently have a mixed signal with the Gulf of Guinea and the IOD (Indian Ocean Dipole).
The Gulf of Guinea is the northeastern most part of the tropical Atlantic Ocean from Cape Lopez in Gabon, north and west to Cape Palmas in Liberia.
I am going to forgo going into what the climate models indicate about the Gulf of Guinea forecast temperature anomalies, as they have not panned out over the past few hurricane seasons. I will however state the role played by the Gulf of Guinea. When the Gulf of Guinea is warmer than average/normal (warm anomalies) or a warm neutral, the ITCZ has the tendency to remain further south, (Equatorward) during the season. This is what occurred in the 2021 hurricane season, as we saw many tropical waves exit below 10 degrees north latitude. In addition, we saw many SAL occurrences, even into August. The heaviest of the SAL outbreaks climatologically occur in the month of July. With the ITCZ further south, it doesn’t extend into the Sahel region of Africa, hence drier conditions and more dust. When the Gulf of Guinea experiences cooler anomalies (colder than normal), it allows for a shift northward in the ITCZ/Monsoon trough, due to the reverse pressure pattern, bringing greater rainfall to the Sahel region, which would aid in a reduction in the SAL.
GULF OF GUINEA
 Another item in the forecast regarding Sea Surface Temperature Anomalies is the IOD (Indian Ocean Dipole). The forecast from climate modeling tends to show the IOD continuing to slowly cool, remaining in a “neutral” state, and becoming negative by the peak of the season. This would be a slightly enhancing factor in hurricane development, as a neutral to negative IOD has the opposite effect of a positive IOD phase. During a positive IOD phase, you’ll notice the “Walker” circulation allowing for an increase in convection and rain near east Africa. The rising air causes lower pressure and precipitation at the ocean surface. You’ll see on the eastern side of the circulation, air sinks to the surface, causing higher pressure at the surface and drier conditions. Well, it just so happens, this exact flow happens on the western portion of the circulation. The air rises, and as it reaches the upper portion of the atmosphere, it cools, then begins to sink (higher pressure). As this air in the upper atmosphere sinks, it compresses and heats, drying out the air, hence the “lack” of convection for easterly waves. A negative IOD phase has the opposite effect. As the air “sinks” over the western Indian Ocean, it spreads out over the surface, and across eastern Africa. The pattern then continues with the air “rising” over central Africa, allowing for, or aiding in the formation of convection.
IOD SST ANOMALIES NEGATIVE / POSITIVE

IOD POSITIVE PHASE

IOD NEUTRAL PHASE

IOD NEGATIVE PHASE
 CURRENT IOD FORECAST FROM BOM, AND NASA GEOS


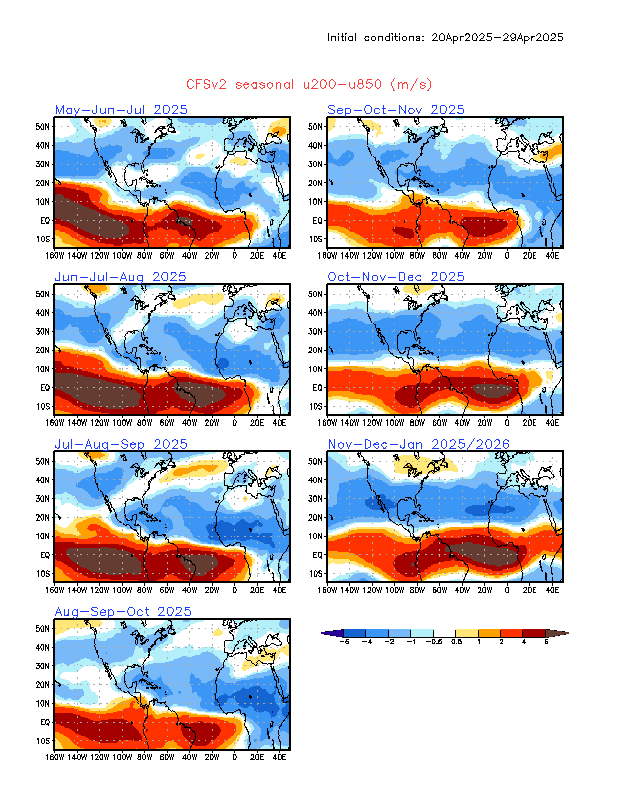
With the forecast of mainly NEUTRAL to NEUTRAL – COLD bias ENSO conditions, the CFSv2 is showing somewhat below to strongly below average wind shear over the Atlantic basin (MDR). Shear over the MDR is another negating factor for the hurricane season.
CFSv2 CURRENT SEASONAL u200 – u850 (WIND SHEAR) FORECAST (LINKED)
Again, as all of these parameters update during the next 3 months, adjustments may have to be made, prior to issuing a final seasonal forecast.
Based on analysis of forecast ONI values from the IRI (International Research Institute), which uses 26 different climate models, I came up with the following past hurricane seasons as analog years: 2001, 2012, 2013, and 2018. This was determined from the ONI values and / or value trends based on the average of ALL the climate models, comparing them to the CPC ONI chart, with the years that matched the forecast anomalies, and/or anomaly trends, along with past and current MEI information. The IRI provides an average of the Dynamical models, Statistical models, and an average of ALL 26 models output.
The ONI explained from the site, HDX:
Monthly Oceanic Nino Index (ONI)
The Oceanic Niño Index (ONI) has become the de facto standard that the National Oceanic and Atmospheric Administration (NOAA) uses to identify El Niño (warm) and La Niña (cool) events in the tropical Pacific. It is the three month mean SST anomaly for the El Niño 3.4 region (i.e., 5°N-5°S, 120°-170°W). Events are defined as five consecutive overlapping three month periods at or above the +0.5°C anomaly for warm (El Niño) events and at or below the -0.5 anomaly for cold (La Niña) events. The threshold is further broken down into Weak (with a 0.5 to 0.9 SST anomaly), Moderate (1.0 to 1.4) and Strong (≥ 1.5) events. For an event to be categorized as weak, moderate or strong, it must have equaled or exceeded the threshold for at least three consecutive overlapping three month periods.
Based on the average of the 4 analogs (16.75 storms total, 6.75 hurricanes and 2.0 major hurricanes), my pre-season forecast totals were derived in this manner. Total storms ranged from 14 on the low end to 19 on the high end, hurricanes ranged from 2 on the low end to 10 on the high end, and major hurricanes ranged from 0 on the low end to 4 on the high end.
If you would like a copy of the Hurricane Preparedness post, or previous Hurricane Tutorials, please send me an email.
You may direct any questions this season by contacting me personally, ANYTIME, at: [email protected]
Have a blessed evening!
T. F. “STORM” WALSH III
GMCS, USCG (ret)
METEOROLOGIST / HURRICANE SPECIALIST /SEVERE WEATHER SPECIALIST
MEMBER WEST CENTRAL FLORIDA AMS


 English (US) ·
  French (CA) ·