

 23 hours ago
7
PROTECT YOUR DNA WITH QUANTUM TECHNOLOGY
Orgo-Life the new way to the future Advertising by Adpathway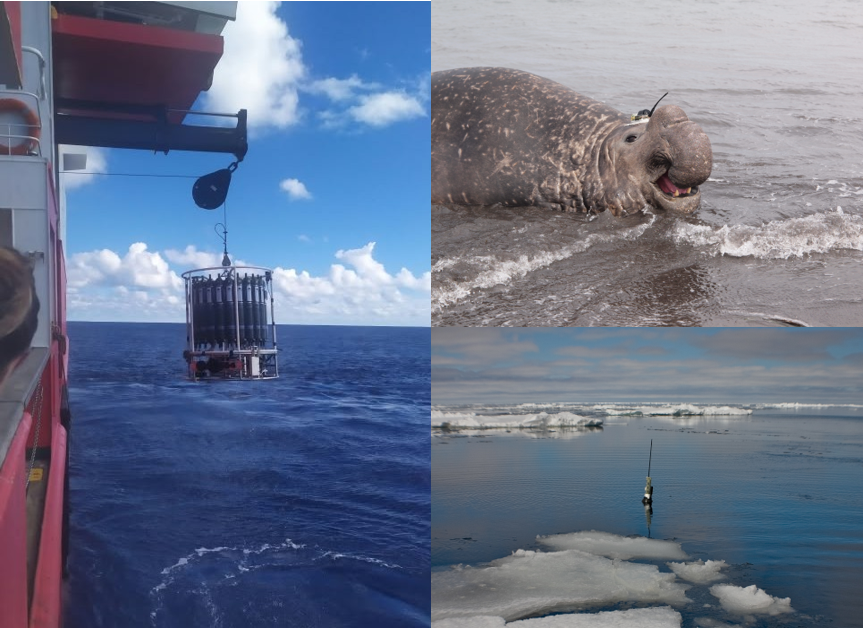 Figure 1. A composite of different ocean observers collecting temperature and salinity profiles: a CTD rosette aboard R/V Sarmiento de Gamboa during the SAGA34S cruise in February 2022 (left), an autonomous Argo float (bottom right), and an instrumented southern elephant seal (top right). Photo credits: CTD - Tania Pereira-Vázquez; Argo float - Argo Program (https://argo.ucsd.edu); elephant seal - Alfred Wegener Institute / Horst Bornemann (CC BY 4.0).
How do you study an ocean that is difficult to reach, frequently covered by sea ice, and far from most research institutions? Collecting observations is one challenge. Finding the measurements that already exist can be another.
Temperature and salinity profiles reveal how seawater properties change with depth, helping oceanographers identify water masses and investigate the ocean’s vertical structure. These observations come from research vessels, autonomous floats and even instrumented marine mammals (Figure 1). Each samples different places, depths and seasons, offering complementary perspectives on the Southern Ocean.
Yet finding these data can be frustrating: observations are scattered across expedition archives, international programmes and national data centres. Knowing where to look and what kind of data each resource provides is a useful first step. Here, I introduce a selection of publicly accessible resources for hydrographic observations and explain what they offer, hoping to make that search easier and provide a starting point for anyone exploring temperature and salinity data from the Southern Ocean.
Seals: observations along unexpected routes
The Marine Mammals Exploring the Oceans Pole to Pole consortium, or MEOP, provides oceanographic observations collected by instrumented marine mammals, including southern elephant seals. As these animals dive, their sensors measure the properties of the surrounding seawater. The resulting temperature and salinity profiles contribute observations in remote polar regions, including parts of the seasonally ice-covered Southern Ocean.
MEOP offers publicly available, quality-controlled collections. Access involves a short form, and users should follow the accompanying citation guidance. These measurements are particularly valuable because the animals reach places and seasons that are difficult to sample from ships. Their routes, however, follow animal behaviour rather than a regular survey grid.
Floats: returning through the seasons
Argo adds another perspective through autonomous profiling floats. Its data system provides profile files, quality-control information and tools for selecting observations. In polar waters, specially adapted floats can continue sampling through winter. Ice-avoidance strategies help them operate beneath seasonal sea ice, storing observations when they cannot surface to communicate.
This extends our view beyond the summer months, when most ship-based sampling takes place, although observing beneath sea ice comes with challenges. Floats must store their measurements until they can surface and transmit them. Without satellite positioning under the ice, profile locations remain uncertain and need to be estimated by reconstructing the float’s trajectory.
Ships: detailed snapshots worth revisiting
Ship observations remain an essential part of the picture. CCHDO provides access to vessel-based CTD and hydrographic data from programmes including GO-SHIP, WOCE and CLIVAR. Its search tools help users locate cruises or individual profiles. PANGAEA offers another route into expedition datasets. Searches can be narrowed geographically and by date, helping users find measurements associated with particular regions or campaigns.
Combining datasets from different expeditions can help answer questions beyond the scope of a single cruise. For example, the publicly available Polarstern PS117 collection includes physical oceanographic observations from its 2018-2019 expedition, which were combined with data from three other cruises to investigate boundary-current and water-mass variability in the northwestern Weddell Sea (Pereira-Vázquez et al., 2026). Figure 2 shows the PS117 hydrographic section used in that study, illustrating how archived observations can contribute to a broader scientific picture.
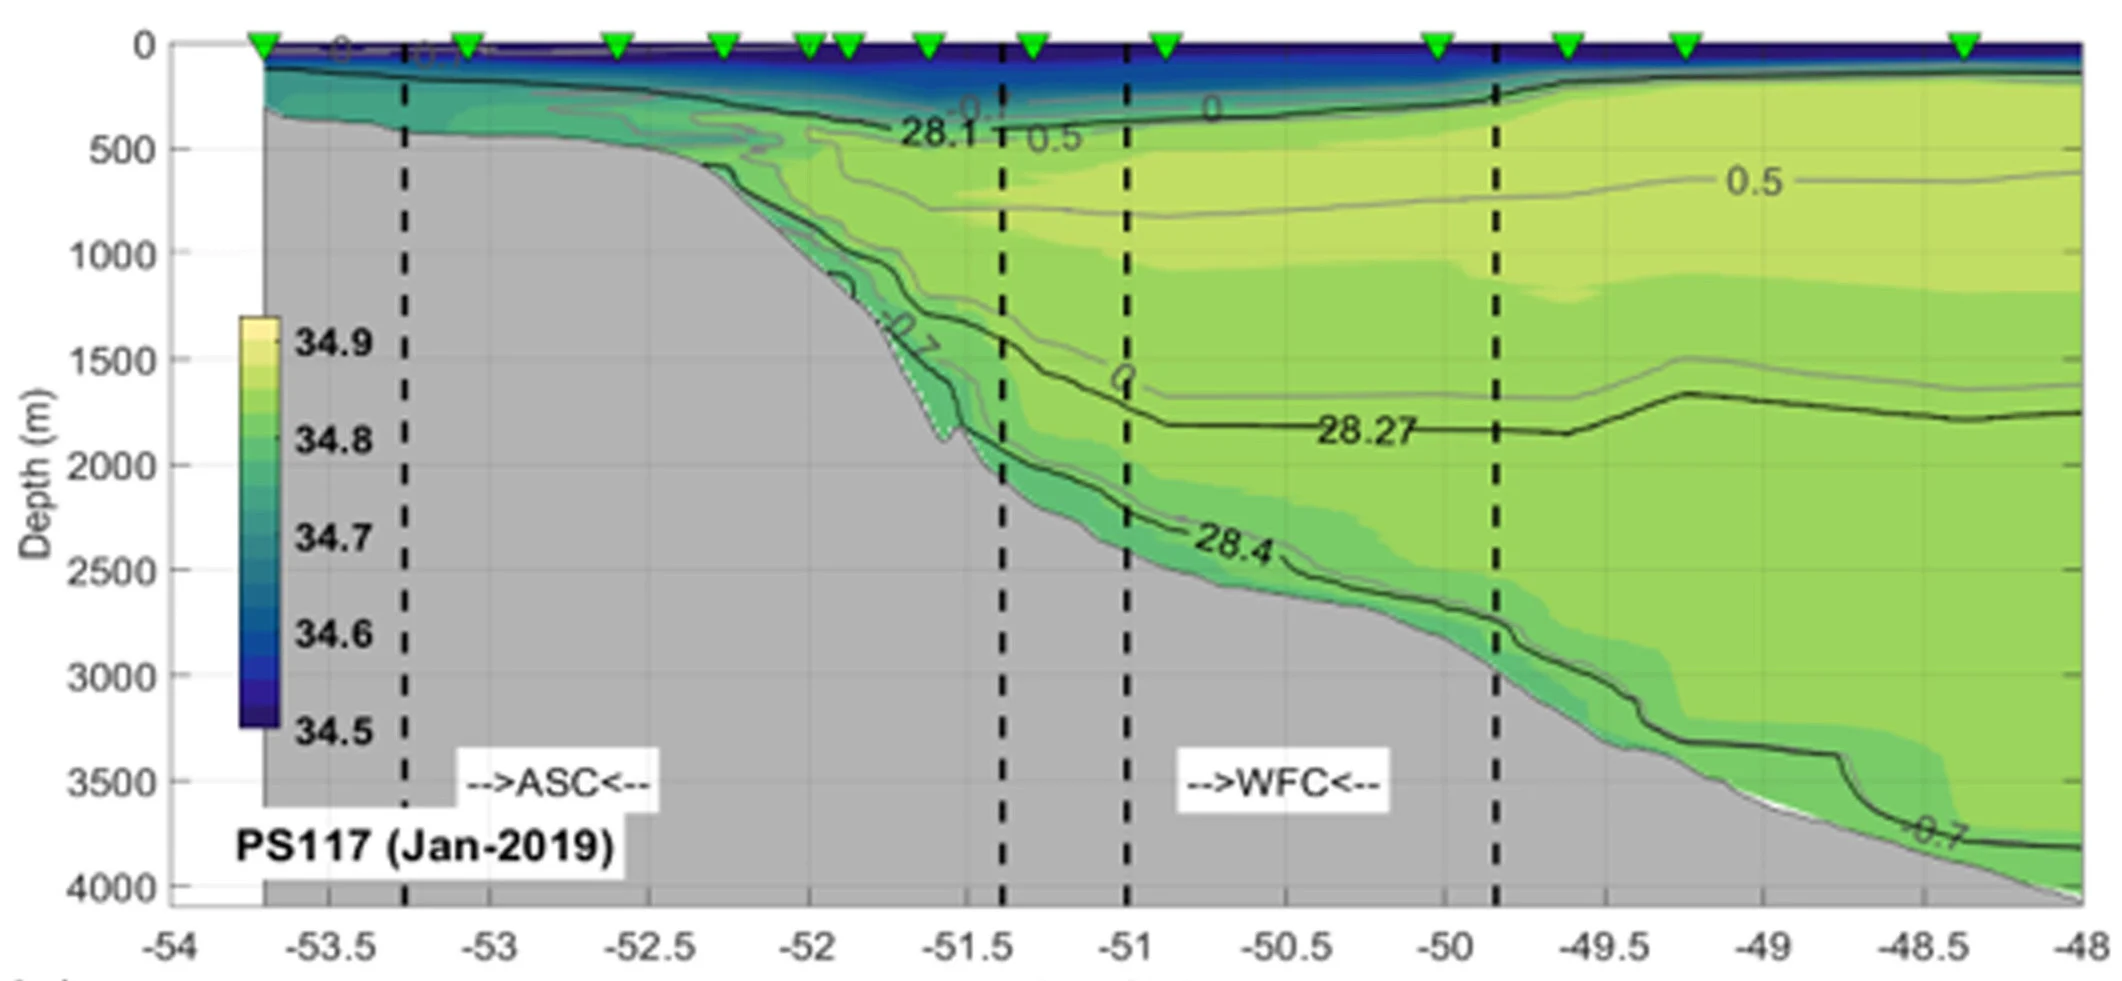
Figure 2. A look beneath the surface of the northwestern Weddell Sea. This section combines CTD profiles collected during Polarstern expedition PS117 in January 2019. Colours show Absolute Salinity, while grey and black contours represent Conservative Temperature and neutral density, respectively. Green triangles mark sampling stations; dashed vertical lines delimit the Antarctic Slope Current (ASC) and the current associated with the Weddell Front (WFC). Panel extracted from Figure 4c of Pereira-Vázquez et al. (2026), https://doi.org/10.1029/2025JC023367. Hydrographic data: https://doi.org/10.1594/PANGAEA.910663.
Finding data is only the beginning
If you do not know which programme sampled your region, SOOSmap provides a geographical entry point to observations from multiple providers. NOAA’s World Ocean Database offers a broad collection of historical profiles, while national resources such as Spain’s Centro Nacional de Datos Polares help locate polar research datasets and their metadata.
Finding a promising dataset is only the beginning: its suitability depends on when and where the observations were collected, the depths they cover and their quality. The accompanying documentation provides essential context for interpreting the measurements and assessing their suitability for a particular study. Access and reuse conditions may also vary between datasets. There can also be overlap between resources, with the same observations appearing in several portals, a useful reminder that more downloads do not always mean more independent measurements. Taking a little time to check each dataset before using it can therefore make all the difference in finding the right observations for your question.
Although open archives cannot close the Southern Ocean’s observational gaps, they help us make the most of existing measurements and identify where future observations could make a difference. Hopefully, this guide makes it a little easier to find the data you need. Good luck with your search!
More info and references:
https://argo.ucsd.edu/expansion/polar-argo/
https://www.ncei.noaa.gov/access/metadata/landing-page/bin/iso?id=gov.noaa.nodc:NODC-WOCE-GDR
https://www.ncei.noaa.gov/products/world-ocean-database
https://cndp.utm.csic.es/portal
Pereira‐Vázquez, T., Janout, M., Llanillo, P. J., Veny, M., & Aguiar‐González, B. (2026). Structure and dynamics of the Antarctic slope and Weddell fronts along the SR04 WOCE section based on four oceanographic cruises (2007–2022). Journal of Geophysical Research: Oceans, 131, e2025JC023367. https://doi.org/10.1029/2025JC023367










 English (US) ·
 French (CA) ·