

 16 hours ago
10
16 hours ago
10
PROTECT YOUR DNA WITH QUANTUM TECHNOLOGY
Orgo-Life the new way to the future Advertising by AdpathwayDisclaimer: This site is not affiliated with the National Hurricane Center, Hurricane Hunters, Storm Prediction Center, or National Weather Service. ALL forecasts herein are the result of my analysis, (to which you will see me at times, insert excerpts from various agencies due to the nature of the importance of the information) and I am solely responsible for the content. As ALWAYS, follow the National Hurricane Center, National Weather Service, and your local Emergency Management officials for emergency decisions. In addition, this is strictly a FORECAST OFFICE. I CANNOT make decisions regarding travel plans, etc. My purpose, is to provide you the information, based solely on information I analyze, and the accuracy of the information at hand of the time of analysis, so you may make informed decisions.
(T. F. “Storm” Walsh)
For those who have donated to my site, your help has been greatly appreciated. If you are not aware, donations to my site help pay for subscriptions to sites I use as well as software updates, which provide all the models and information used in my forecasts. To donate, please click the DONATE button to the right side of the page, or on the graphic of the dog. Any help you provide is immensely appreciated!
DONATIONS ACCEPTED AND APPRECIATED

I will reiterate, my forecasts are based on the available information at the time of analysis, and are only as accurate as the information analyzed and the solutions provided.
Good day everyone!
If anyone has any questions regarding tropical systems, please feel free to email me at the email address at the end of the synopsis. Please title it WEATHER QUESTION.
The following changes have been made. The forecast center is still closed on Sunday, and will be closed on Saturday as well (unless there is a threat from a tropical system). Please refer to the Storm Prediction Center for severe weather information.
SPC LINK
https://www.spc.noaa.gov/
These forecasts can be lengthy, however I want to always give a full perspective on the tropics.
STORM W SEASONAL FORECAST
TOTAL NAMED STORMS: 9 – 11
TOTAL HURRICANES : 3 – 4
MAJOR HURRICANES: 1 – 2
AVERAGE HURRICANE SEASON:
TOTAL NAMED STORMS: 14
TOTAL HURRICANES: 7
MAJOR HURRICANES: 3
CSU (Dr. Phil Klotzbach) SEASONAL FORECAST
TOTAL NAMED STORMS: 9
TOTAL HURRICANES: 4
MAJOR HURRICANES: 1
WEATHERBELL (Chief Forecaster Joe Bastardi)
TOTAL NAMED STORMS: 9 – 13
TOTAL HURRICANES: 3 – 5
MAJOR HURRICANES: 1 – 2
2026 SEASON TOTALS
TOTAL NAMED STORMS: 5
TOTAL HURRICANES: 0
MAJOR HURRICANES: 0
The following is the list of storm names for the 2026 Atlantic Hurricane Season. Storm names will be marked in RED for active and already named systems with subtropical systems marked in PURPLE:
Arthur Bertha Cristobal Dolly Edouard Fay Gonzalo Hanna Isaias
Josephine Kyle Leah Marco Nana Omar Paulette Rene Sally Teddy Vicky
Wilfred
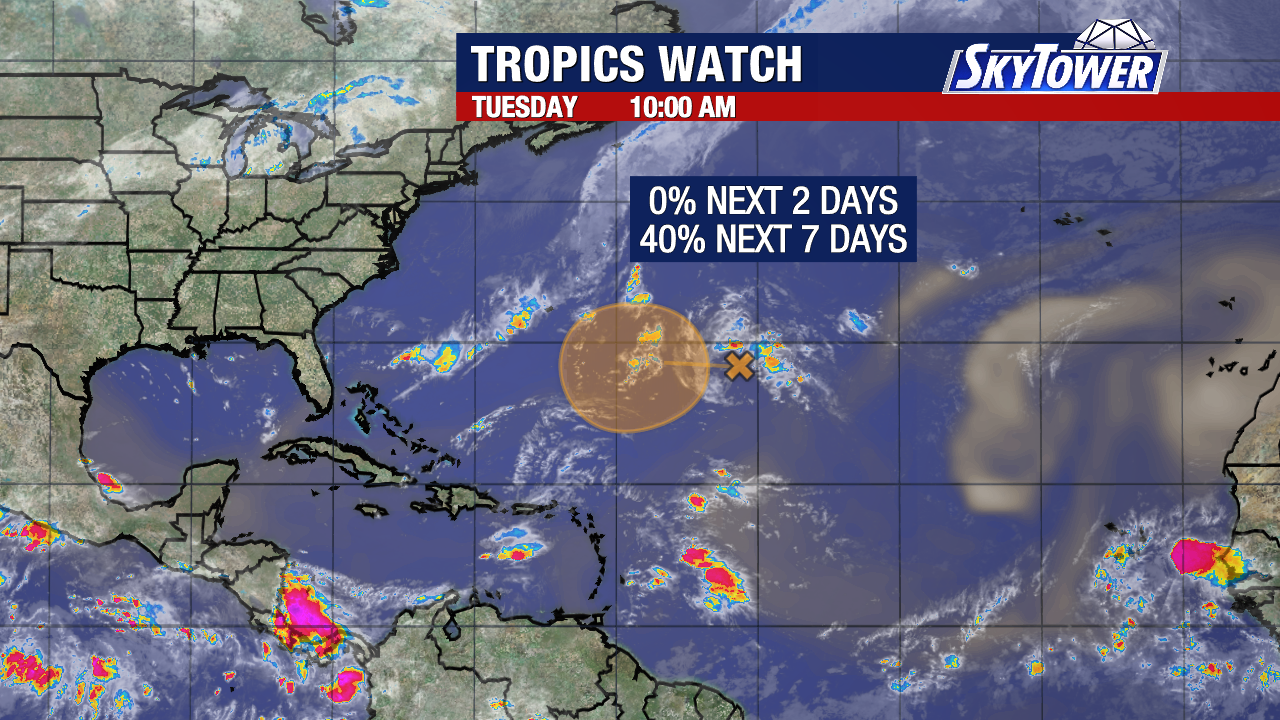
Satellite loop imagery indicates a little more convective activity over the Atlantic, with another wave getting ready to exit Africa, and increased activity in the wave train over Africa. Water vapor imagery shows some reduction in drier air. The area in the central subtropical Atlantic was designated INVEST 98L by mid-day yesterday.
GOES 19 ATLANTIC IR AND WV SATELLITE LOOP (LINKED…CLICK IMAGES)

AFRICA IR AND WV SATELLITE LOOP (LINKED…CLICK IMAGES)

The NHC GTWO currently indicates a MEDIUM (40%) probability of development regarding INVEST 98L
NHC 7 DAY GTWO (LINKED TO OUTLOOK)
The NHC Surface Analysis indicates tropical wave locations as of 12Z this morning.
12Z NHC SURFACE ANALYSIS IMAGE
As of the 12Z (8:00 a.m. EDT) ATCF BTK report, the following was available on INVEST 98L:
8:00 AM EDT Thu Sep 26
Location: 33.0°N; 59.2°W
Moving: WNW at 9 mph
Min pressure: 1020 mb / 30.12 in.
Max sustained: 30 mph
CLOSEUP IR, VIS AND WV LOOP INVEST 98L


WHY this has been designated is beyond me. The central minimum pressure was reported to be 1020 mb (30.12 in). For comparison, standard sea level pressure is 1013.25 mb (29.92 in.), and the “average” pressure of the Azores – Bermuda high is 1024 mb (30.23 in.). Anyway, with that said, the disturbance is currently moving toward the WNW based on the ATCF BTK product and current steering layers analysis. Based on my analysis of forecast steering layers maps, the disturbance should continue on this track pretty much for the next 24 hours, with a turn more to the NW. Based on the majority of guidance models, this is the preferred track by the more accurate guidance and hurricane models. The NHC currently indicates this could take a shift toward the south, and I cannot rule this out totally at the moment, as analysis of current forecast steering maps indicates some of the maps show a north to south flow in around 72 hours, then creating a loop back to the WNW. But as stated, the majority of track guidance indicates a NW track, then a recurve to the NE which I prefer at the moment. This will depend on the actual organization and intensity of the system.
RAL 12Z TRACK GUIDANCE (CLICK FOR LARGER IMAGE)
Analysis of the current wind shear map indicates the system is currently under 25 – 30 kts of wind shear. Because of this, you can see the LLC is exposed to the north of the limited convection in the visible satellite loop posted above.
CIMSS 98L WIND SHEAR
Based on analysis of the ECMWF model, and information contained in the current SHIPS diagnostic report, wind shear intensity is forecast to fluctuate between unfavorable to slightly favorable, with an increase to 30 kts forecast at 72 hours in the period. Based on forecast intensity values and duration, it does not appear shear will be at favorable levels long enough for this to become vertically stacked, or organized. Based on analysis of water vapor imagery, the center is currently situated in dry air, and marginal surface moisture. Based on the SHIPS diagnostic report, current 700 – 500 mb relative humidity values (55%) are below the favorable 60% value for development. While the current ECMWF is a little more generous, the forecast calls for drier air to affect the system, and SHIPS indicates the RH values to drop below 50% in 24 hours. Analysis of lower level convergence and upper air divergence indicated a lack of both over the center and immediate surrounding area. Based on all of these factors, if the modeling is accurate, I really do not expect development from this system at the moment. Keep in mind, this must have “organized deep convection” about or over a well defined surface circulation for at least 24 hours.
RAL 12Z INTENSITY GUIDANCE
I will continue to monitor this area closely during the next 24 – 72 hours.
I will be monitoring any waves coming off Africa as well over the next few days.
I do not expect and tropical cyclone formation during the next 7 days.
ECMWF MSLP ANOMALIES ANIMATION 120 HOURS 
Elsewhere, based on the most recent MJO (Madden Julian Oscillation) phase space diagram forecast, the MJO is now entering into PHASE 8 and is forecast to enter PHASES 1 and 2 within the next 10 – 20 days, and is verified by the JMA CHI200 anomalies forecast update. These are favorable phases for tropical development on our side of the world. The forecast indicates a slowing of forward speed of the MJO, with more of a majority of ensemble members now clustered in those phases. Slow forward motion of the MJO aids in the reduction of wind shear. This could allow for possible development in the W. Caribbean, Gulf, or close in development IVO the SEUS coastal area. Based on this, I believe we should see some uptick in activity by the end of the month, and through at least the first 2 weeks of Oct. Keep in mind that what I am going to point out, is too far out in the forecast period to be considered accurate, but we have a strange phenomenon occurring between the ECMWF and GFS global models in agreement, indicating activity in the W. Caribbean in 2 weeks. All this means is, models may be “seeing” this due to the MJO forecast.
ACCESS – S2 MJO PHASE SPACE DIAGRAM FORECAST (CLICK FOR LARGER IMAGE)
ECMWF MJO PHASE SPACE DIAGRAM FORECAST
JMA CHI200 ANOMALIES FORECAST 19 SEP – 25 SEP
26 SEP – 02 OCT
MJO PHASES CHART
MJO PHASE 8 AND 1 OBSERVED DEVELOPMENT (ORANGE / RED COLORING)
EXCESSIVE RAINFALL
https://www.wpc.ncep.noaa.gov/qpf/excessive_rainfall_outlook_ero.php
SIGNIFICANT RIVER FLOOD OUTLOOK
https://www.wpc.ncep.noaa.gov/nationalfloodoutlook/index.html
Please click on the following map to access the current statements, advisories and warnings from the NWS. Once you click the map, click on your area of interest.
NWS WATCH / WARNING DISPLAY (LINKED…CLICK MAP, THEN YOUR AREA)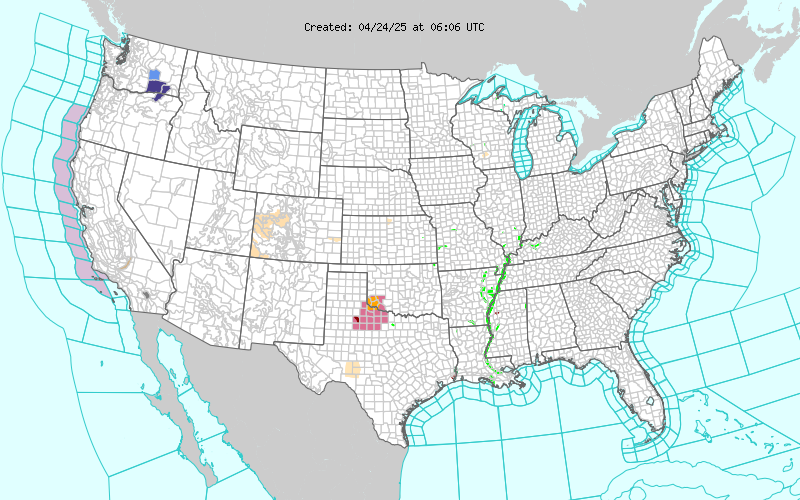
NWS RADAR
RAP RADAR (CLICK IMAGE THEN GO TO LOOP DURATION AND PICK LENGTH OF LOOP, THEN CLICK RADAR SITE) WUNDERGROUND RADAR SUMMARY MAP (CLICK FOR UPDATES)
 PRECIPITATION TYPE (CLICK TO ACCESS ANIMATION FEATURE)
 CARIBBEAN RADAR (CLICK IMAGE TO ACCESS ANIMATION)

You may direct any questions to me by contacting me personally, ANYTIME, at: [email protected]
Have a blessed day!
T. F. “STORM” WALSH III
GMCS, USCG (ret)
METEOROLOGIST / HURRICANE SPECIALIST / SEVERE WEATHER SPECIALIST
CoCoRAHS OBSERVER















 English (US) ·
  French (CA) ·